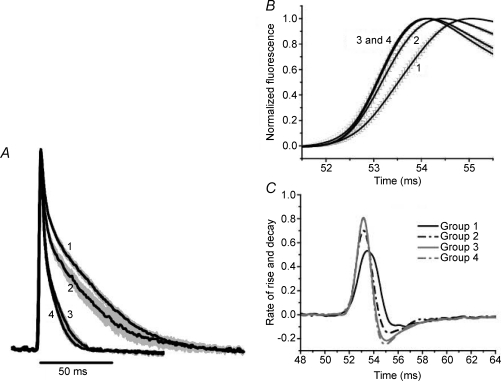
Figure 2. Time course of mean Ca2+ transients of different fibre groups.
A, mean Ca2+ transients. Numbers represent groups as in Table 1. Note that the decay phase of the Ca2+ transients can be paired (slow pair, 1–2, and fast pair, 3–4) in close correspondence to the PV content (see the Fig. 5 of Füchtbauer et al. 1991). B shows a detail of the raising part of the mean Ca2+ transients in A, to stress the differences obtained in the 4 groups. Note that group 2, although closer to group 1 in the decay phase, is closer to groups 3 and 4 regarding the rising phase. C represents the differentiation of the records in A, and shows that groups 3 and 4 have the maximal rates of rise and decay, group 1 the minimal and group 2 intermediate rates.

