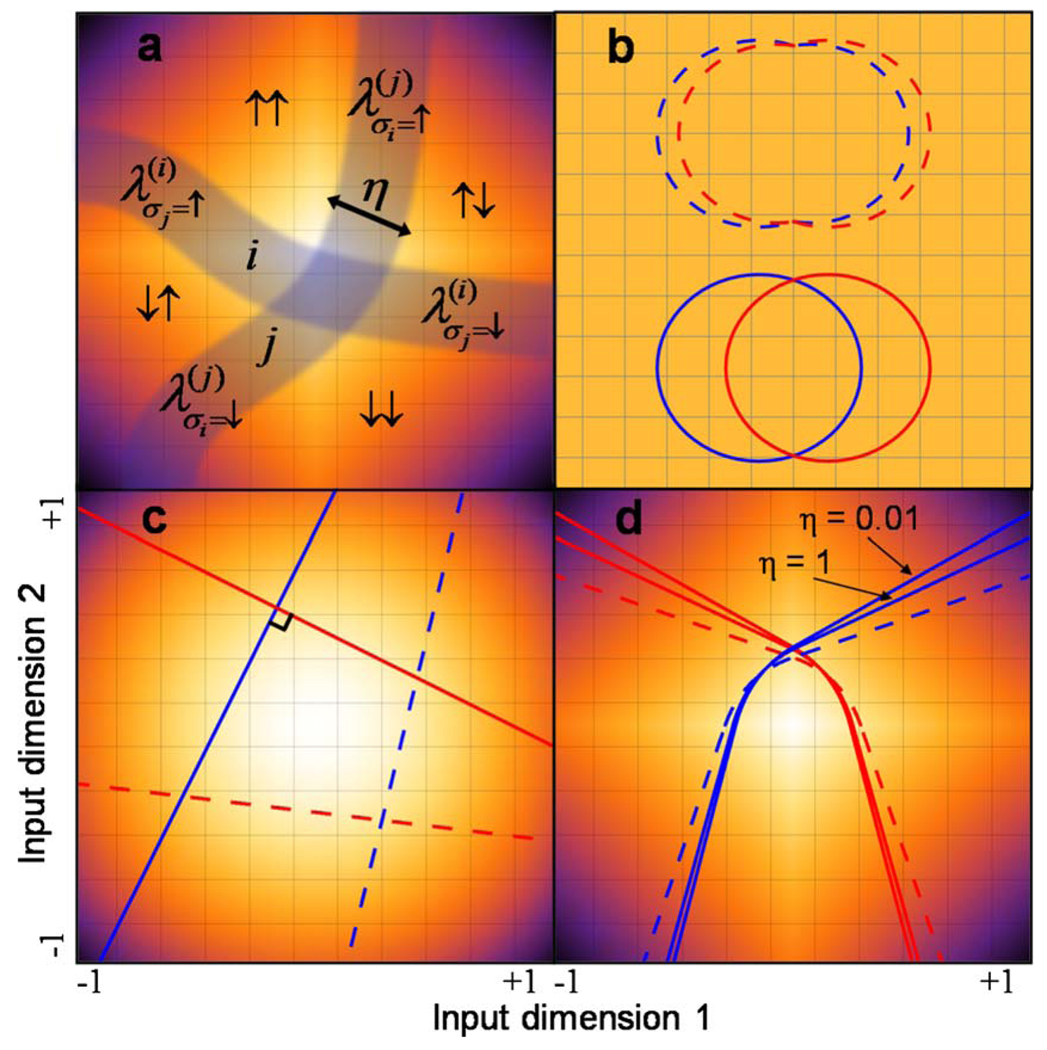
FIG. 3.
(Color online) Network decision boundaries. Color in input space corresponds to the input distribution Pℐ and each line is a boundary for an individual neuron. (a) For a general intersection between neurons i and j, the two boundaries divide the space into four regions corresponding to the possible network states (e.g., Gσi=↑,σj=↑). Each segment has a width η which determines the noise level and is described by a parameter [cf. Eq. (10)]. (b) In a uniform space, with two neurons (different colors/shading), the boundary segments satisfying the optimality condition are circular. Networks which have segments with different curvatures (dashed) are less informative than smooth circles (solid). (c) In a Gaussian space (in units of standard deviations), straight perpendicular lines (solid) provide more information about inputs than decision boundaries that intersect at any other angle (dashed). (d) For approximately natural inputs (plotted in units of standard deviations), the suboptimal balanced solutions (dashed) are two independent boundaries with the same P. The optimal solutions (solid) change their curvature at the intersection point and depend on the neuronal noise level η.

