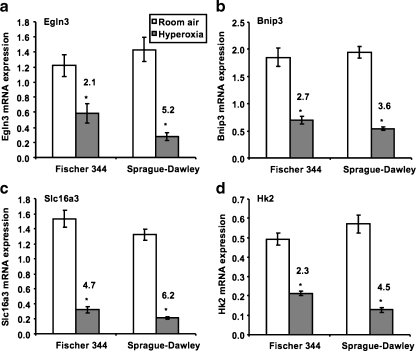
Fig. 2.
RT-PCR quantification of retinal gene expression in cyclic hyperoxia-treated and untreated F344 and SD rats at post-natal day 3. a Egln3; b Bnip3; c Slc16a3; d Hk2. Quantification was performed on RNA pools identical to those used in the microarray analysis. Expression levels were normalized to the reference genes Arbp and Hprt. Numbers above the bars are fold inhibition by hyperoxia. Error bars ± standard deviation. *p < 0.05

