
Figure 5.
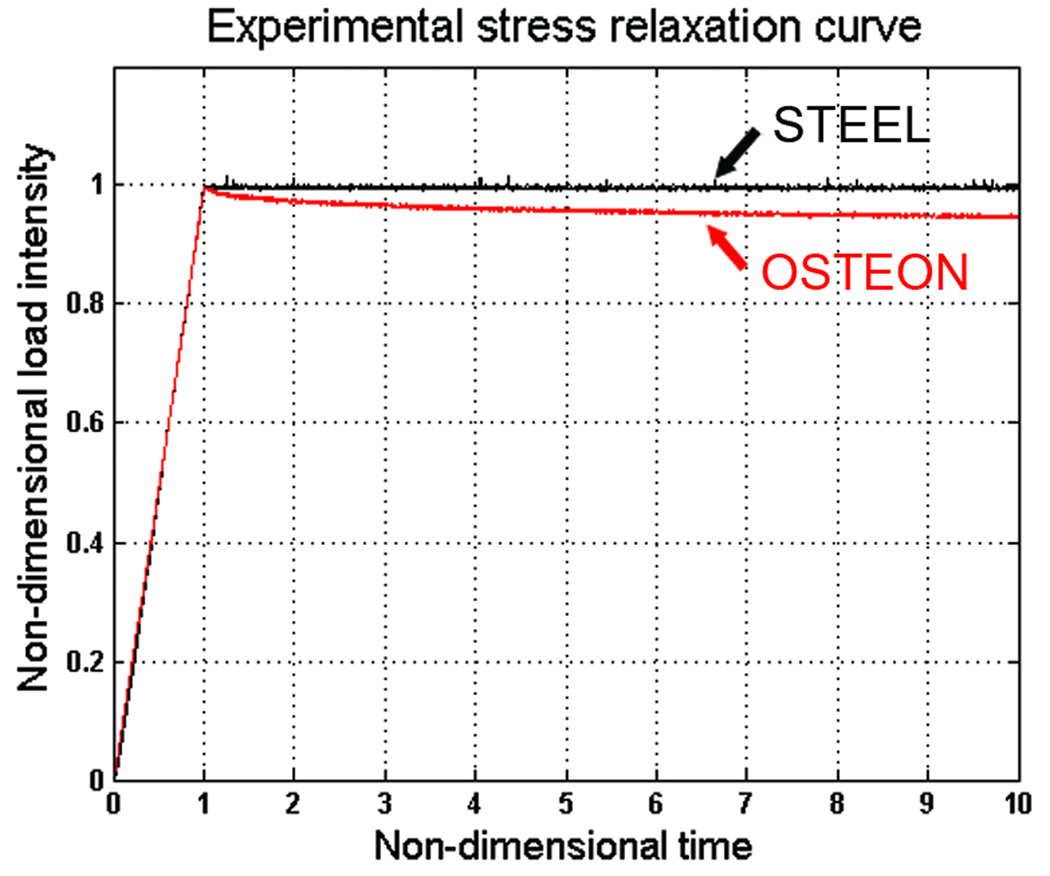
Stress relaxation curve for a sample made of steel and for one of the isolated osteons in response to a ramp displacement with constant strain rate (ε̇ ≈ 100 με s−1). The load intensity and loading time in both curves were normalized by the peak load intensity and t0 respectively.