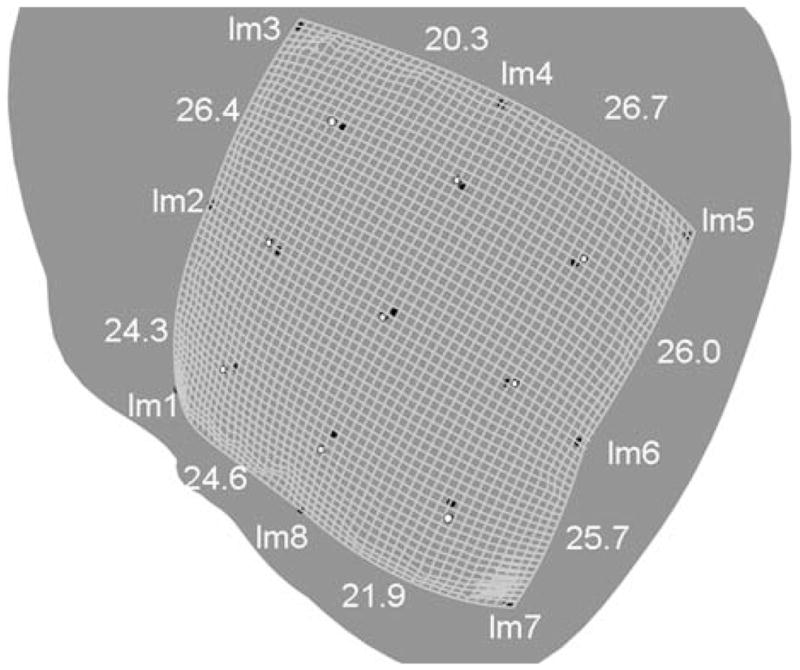
FIGURE 7.

Laplacian scheme applied to the test problem shown in Fig. 1. The grid is 50 × 50 divisions, so that each square is approximately 1 × 1 mm2. The actual (MRI image determined) eight boundary landmark points (lm1–lm8), and the nine interior points, are shown as black circles. The computed interior points are shown as white filled circles. The computed geodesic distances between landmarks are also shown. To allow for all of boundary and interior points to be seen in the figure, the heart had to be rotated; the resulting view, as shown, resulted in some parallax, such that the computed boundary appears to be outside all of the actual boundary points, which was not the case. The computed boundary aligned almost exactly with the four corner landmark points.
