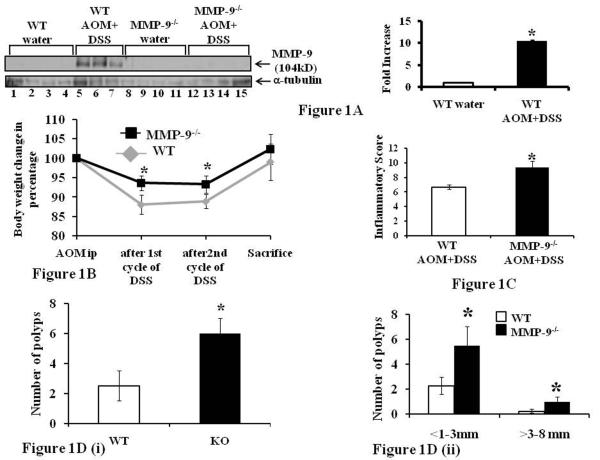
Figure 1.
MMP-9 is highly expressed in CAC and MMP-9-/- mice show increased susceptibility to CAC. WT and MMP-9-/- mice (mice, n= 6 each group) were treated once with AOM and twice with 3% DSS to induce CAC. Mice were weighed once a week and were sacrificed after 56 days. 1A: western blot of proteins from the mucosal stripping of the colons of WT and MMP-9-/- mice with and without CAC probed with anti-MMP-9. Each lane shows protein (30μg/lane) from an individual mouse with or without CAC induction. Western blots were quantitated by scanning densitometry. Values are representative of three experiments, each bar represents mean ± S.E., *p<0.05. 1B: change in body weight of WT and MMP-9-/- mice (mice, n= 10 each group). 1C: inflammatory score, 1D(i): polyps count and 1D(ii): size of the polyp measured in diameter as described in the Methods section. Each bar represents mean ± S.E., *p< 0.05.

