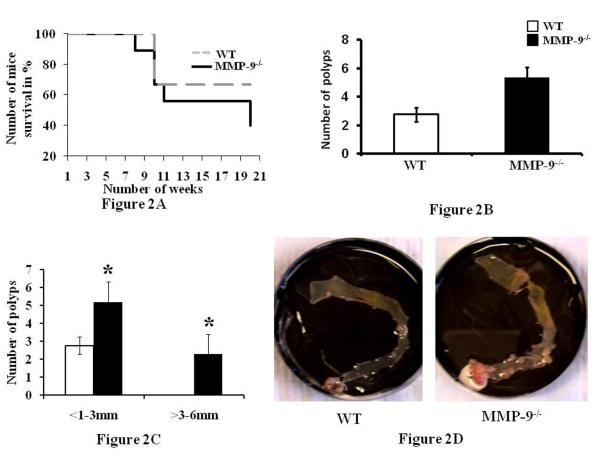
Figure 2.
MMP-9-/- mice show increased susceptibility to CAC and mortality. Mortality studies were done as described in the Methods section. 2A: shows the mortality among WT and MMP-9-/- mice induced with CAC and followed for a total of 140 days or were sacrificed if they developed rectal prolapse and/or ≥20% body weight loss. 2B: polyps count and 2C: size of the polyp measured in diameter as described in the Methods section. Each bar represents mean ± S.E., *p< 0.05. 2D: representative gross anatomy of the colon of the MMP-9-/- mice and WT mice reflecting the number of polyps among them.

