Fig. 3.
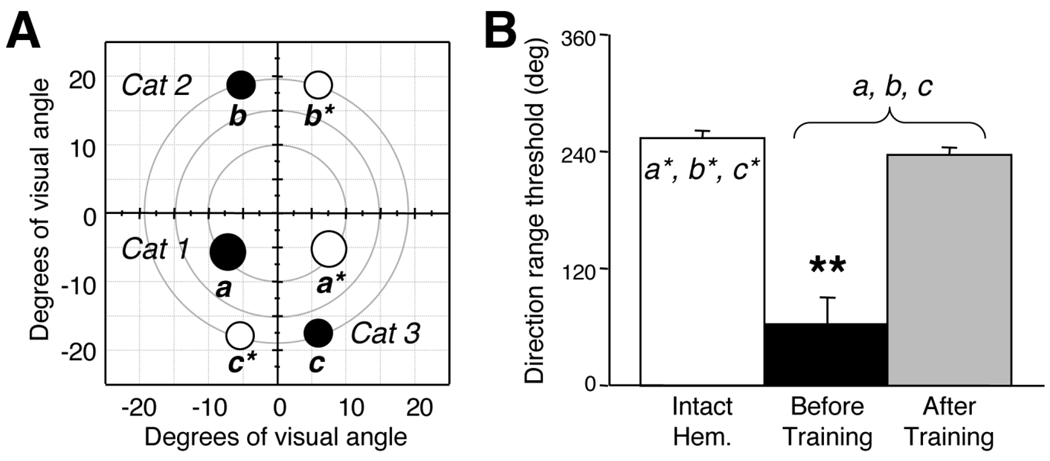
Location of visual retraining after LS lesions in Cats 1, 2, and 3. A: Visual field map illustrating visual field locations chosen for retraining (black circles labeled a, b, and c) in the impaired hemifields of Cats 1, 2, and 3. Performance was also mapped at corresponding, control locations in the intact hemifields of Cats 1, 2, and 3 (white circles labeled a*, b*, and c*). B: Histogram plotting mean direction range thresholds at control and retrained locations (shown in A), averaged among Cats 1, 2, and 3. The white bar indicates thresholds at control locations (a*, b*, and c* in A) in the intact hemifields, where cats can tolerate a large range of dot directions and still correctly perceive the global direction of motion of the random dot stimulus. Black and gray bars show performance at contralesional locations a, b, and c (shown in A) before (black) or after (gray) direction discrimination training by using random dot stimuli in which the range of dot directions was varied. Note the significantly abnormal performance before the onset of training and the recovery to normal direction range thresholds after training. Error bars = standard deviations. **, P < 0.05, by two-tailed Student’s t-test.

