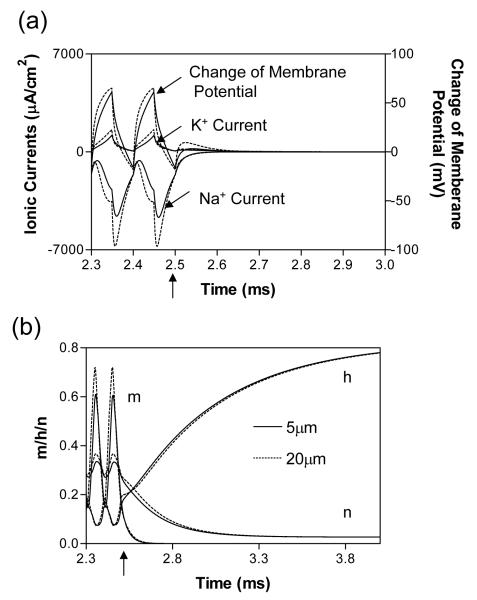
Fig.7.
Change of membrane potential, ionic currents, and activation/inactivation of the ion channels after the termination of block stimulation at the node (0.0 mm) under the block electrode in FH model. Data from axons of diameter 5 μm and 20 μm are both plotted in this figure for comparison. m – activation of Na+ channels; h – inactivation of Na+ channels; n – activation of K+ channels. Stimulation: 10 kHz, 1.2 mA for 5 μm axon, but 0.41 mA for 20 μm axon. The arrows on the time axis marked the time when block stimulation is terminated.

