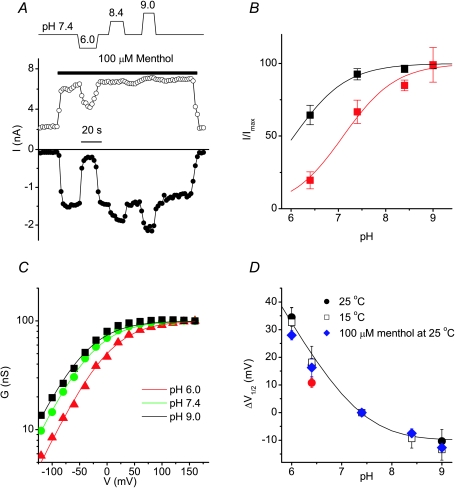
Figure 4. Extracellular protons shift the voltage dependence of TRPM8 activation.
A, time course of menthol-stimulated whole-cell TRPM8 currents measured at the end of 100 ms voltage steps to −80 and +100 mV illustrating the inhibitory effect of extracellular acidification. B, dose dependence of the pH effect at +100 (black symbols) and −80 mV (red symbols). C, comparison of TRPM8 activation curves in the presence of 100 μm menthol at the indicated pH values. Continuous lines represent fits using the Boltzmann equation, where s and Gmax were kept constant for all three experimental conditions, as expected in the case of surface charge screening. D, plot of the shift in V1/2 (ΔV1/2) as a function of pH, for TRPM8 currents at 15°C or at 25°C in the presence or absence of 100 μm menthol. The line represents the best fit using the Gouy–Chapman–Stern equation. The red symbol represents the effect of pH at an extracellular Mg2+ concentration of 20 mm. This data point was excluded from the fit. See text for more details.

