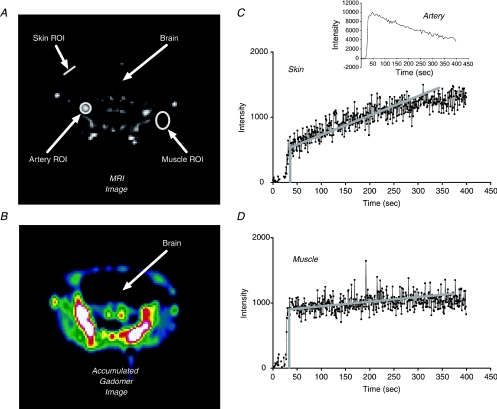
Figure 4. Measurement of 35 kD Gadomer contrast agent apparent permeability coefficient in skin and muscle tissue of C57BL6 control mouse muscle and cheek during vehicle (saline) infusion.
A, MR image (axial slice) of mouse head acquired 200 s after contrast agent injection via the tail vein. The ROIs were carefully selected using anatomical references for muscle, skin and vessels. B, shown is the subtracted image (image in A minus baseline image) recording the signal increase in tissue after injection of Gadomer, where cold colours indicate low signal enhancement and warm colours indicate high signal enhancement. Note the high signal intensity in large arteries showing that most of the high molecular weight Gadomer contrast agent is mainly in the vascular space. C, curve showing the signal intensity changes over time in a ROI used to estimate Gadomer permeability coefficient in the skin. As the contrast agent is injected there is a step increase in tracer signal intensity above background as the vascular volume in the ROI is filled with the contrast agent. Tracer continues to accumulate in the ROI as it enters the extravascular space. The initial rate of tracer accumulation is estimated from the slope of the signal intensity over the first 100–150 s. An initial estimate of the vascular permeability is obtained from the magnitude of the initial slope and step. This initial estimate can be corrected for the fall in vascular tracer concentration (as measured from the signal intensity over an adjacent artery; see inset). D, signal intensity over time in ROI over masseter muscle. Muscle permeability is less than in skin. The analysis to estimate vascular permeability is over an ROI containing no vessels larger than 100 μm diameter. Thus, assuming a mean plasma volume to exchange surface area of 4.4 × 10⁻⁴ cm, the vascular permeability coefficients in muscle and skin tissue were 4.6 ± 0.6 × 10⁻⁷ cm s−1 and 26 ± 3 × 10⁻⁷ cm s−1, respectively.

