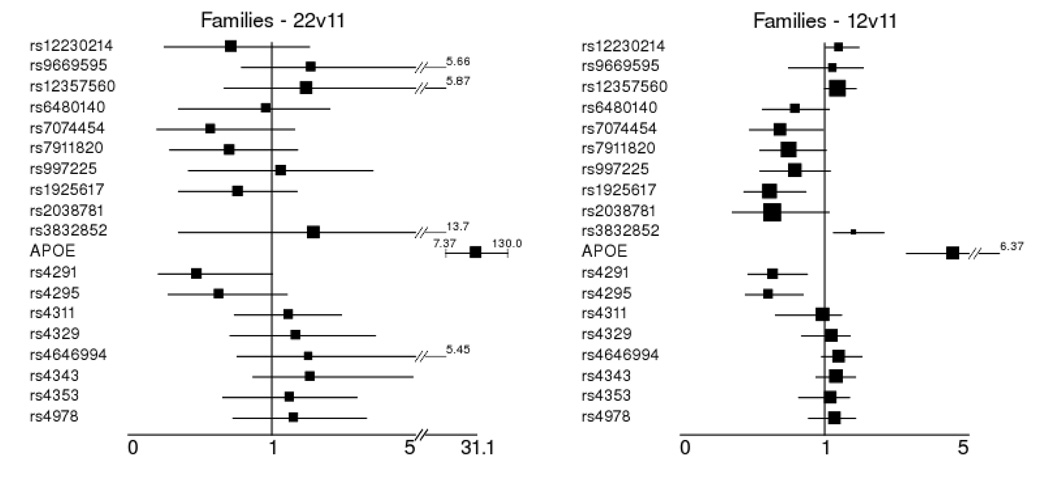
Figure 2.
Odds ratio estimates of effect size from family data using conditional logistic regression and the correction for residual correlation in multiple affected offspring in regions of linkage of Siegmund et al. All estimates are for markers that were significantly associated with AD at alleles or genotypes in either family or case-control data. Estimates are for the homozygote major allele (11) as the referent group versus the other 2 genotypes (221, 122).
1Homozygous minor allele vs. homozygous major allele - 22 genotype compared to 11 (referent group)
2Heterozygote vs. homozygous major allele -12 genotype compared to 11 (referent group)

