Figure 4.
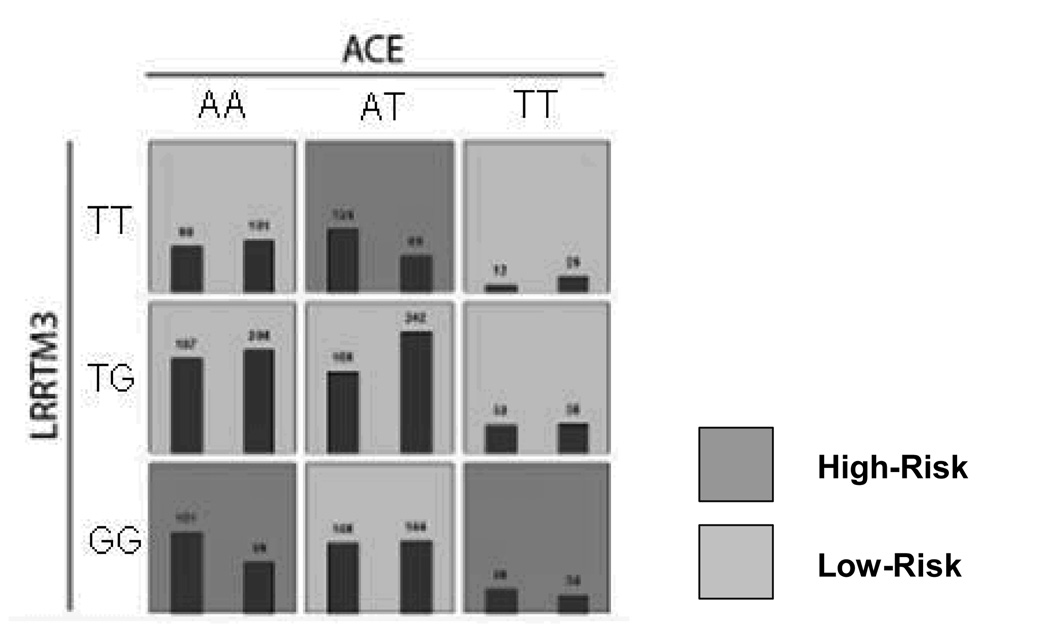
Figure 4a. MDR-PDT two locus model. Summary of multilocus interactions between LRRTM and, ACE. Each multifactorial cell is labeled as “high risk” or “low risk”. For each multifactorial combination, empirical distributions of cases (left bar in cell) and controls (right bar in cell) are shown. The classification accuracy for the 2-locus model is 56.89% (permuted p-value <0.001), with a t-statistic of 4.49 (permuted p-value 0.001).
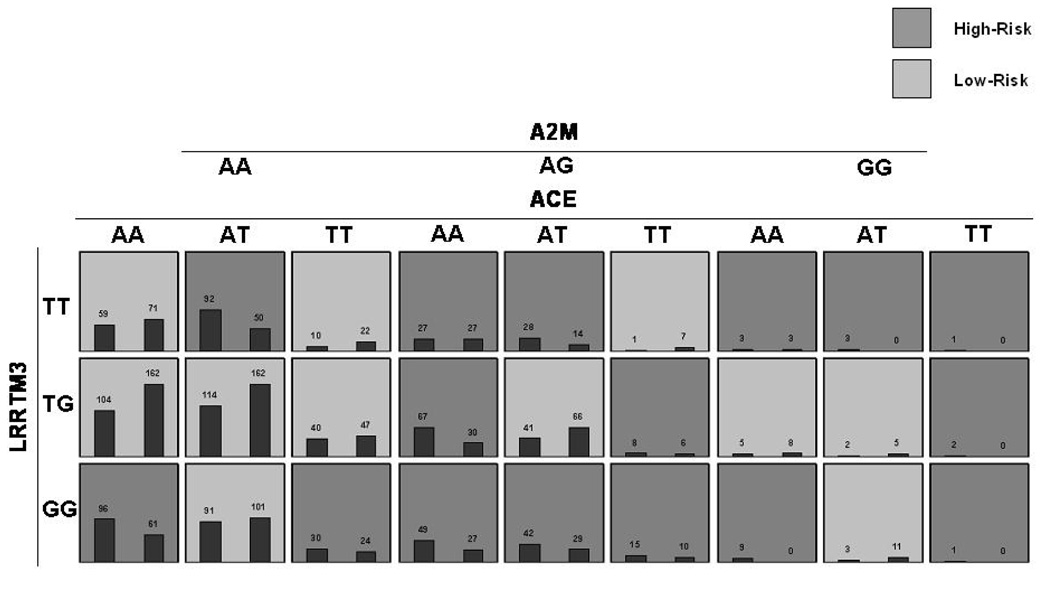
Figure 4b. MDR-PDT three-locus model. Summary of multilocus interactions between LRRTM3, ACE and A2M. Each multifactorial cell is labeled as “high risk” or “low risk”. For each multifactorial combination, empirical distributions of cases (left bar in cell) and controls (right bar in cell) are shown. The classification accuracy for the 3-locus model is 59.58% (permuted p-value = 0.001) with an MDR-PDT-statistic of 5.65 (p-value = 0.001). Of note is the consistent pattern of high-risk cells between ACE and LRRTM3 at the AA genotype of A2M with the 2-locus model, but more high-risk cells at the AT and TT genotypes of A2M, demonstrating the pattern of effect modification on the 2-locus model by A2M.


