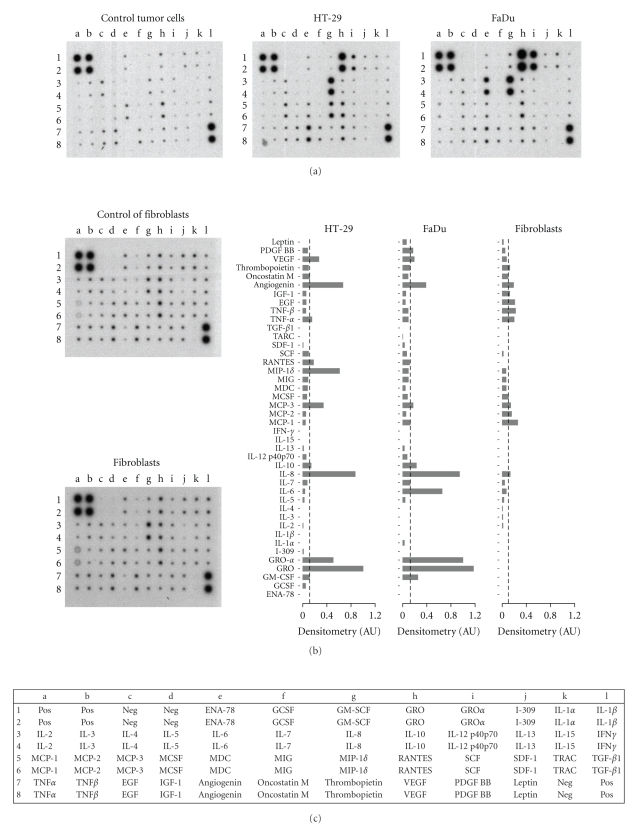
Figure 4.
Protein array analysis of culture medium from HT-29, FaDu and human dermal fibroblasts. Culture medium (DMEM plus 10% FBS) was replaced and collected after 48 hours. Controls were performed with DMEM plus 10% FBS. The proteins that were analyzed are indicated in the bottom panel; pos, positive controls, neg, negative controls. Bars are the densitometric evaluation of samples (right panel); AU, arbitrary units. Values were calculated as the difference between the density value of samples and controls. Bars represent the mean of two independent experiments. Doted lines indicate the value which comprise 75% of the proteins.

