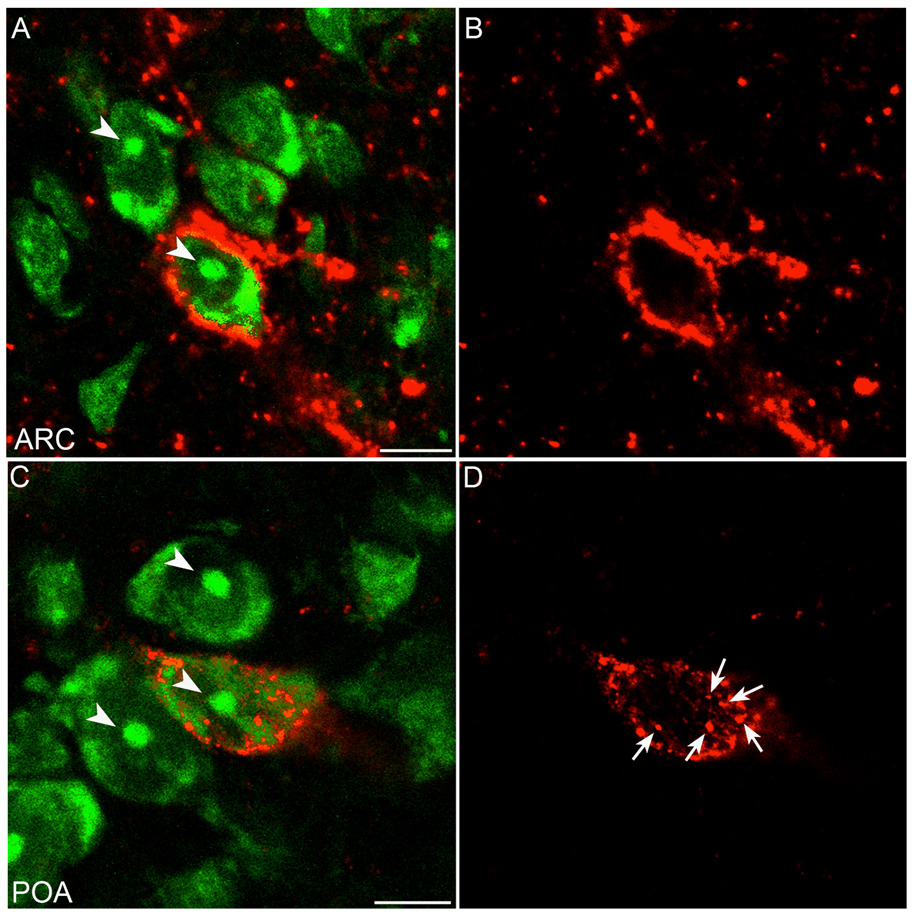
Fig. 5.
Confocal images of representative sections of the ARC (A, B) and POA (C, D). Images represent 1 µm optical sections of tissue processed for immunofluorescent detection of NK3R (red) and counterstained with fluorescent Nissl (green). Arrows indicate fluorescent particles dissociated from the cell membrane. Arrow-heads indicate Nissl-stained nucleolus. Scale bars, 10 µm.

