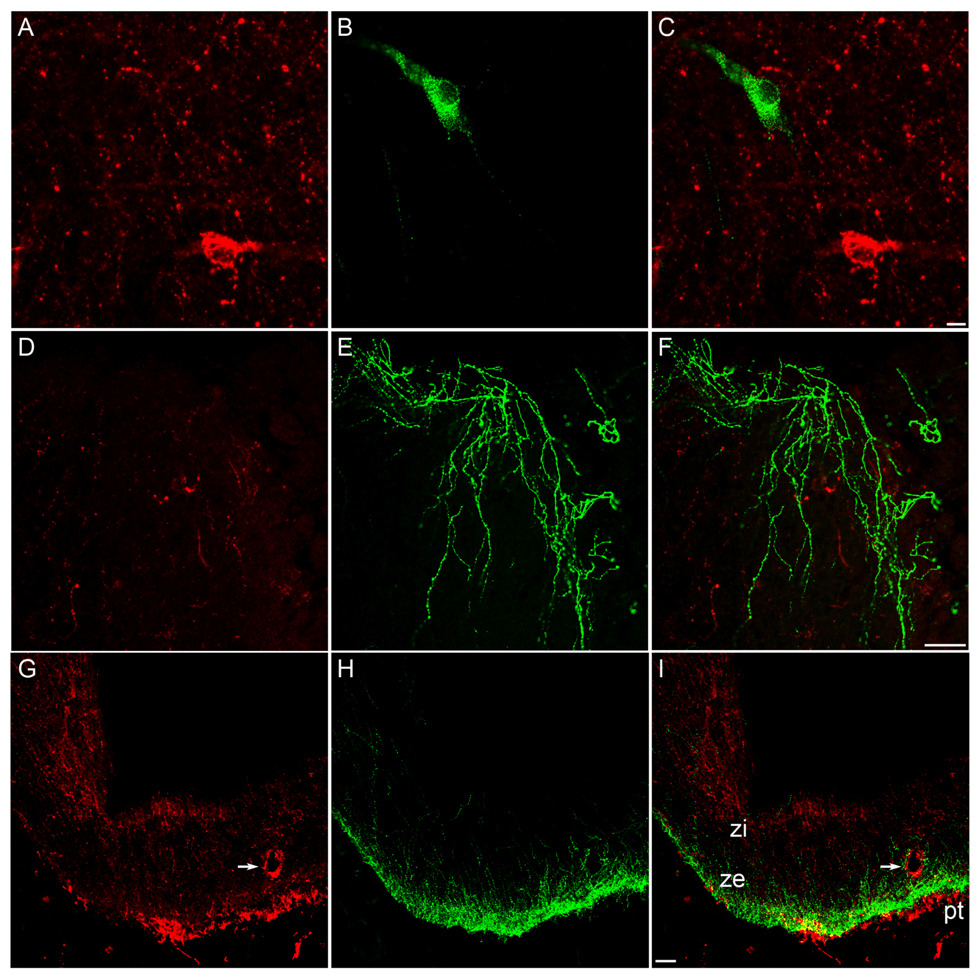
Fig. 6.
Confocal images of representative sections of the POA (A–F) and ME (G–I). Tissue was processed for dual-label immunofluorescent detection of GnRH (green) and NK3R (red). Images represent 1.5 µm optical sections of individual neurones (A–C), 2.5 µm optical sections of fibres in the POA at the level of the OVLT (D–E) and 15 µm optical sections of fibres at the level of the ME (G–I). Panels C, F, and I represent overlays of images on the left. Arrows indicate NK3R-immunoreactivity associated with vasculature. Scale bars, 10 µm (C); 50 µm (F and I).

