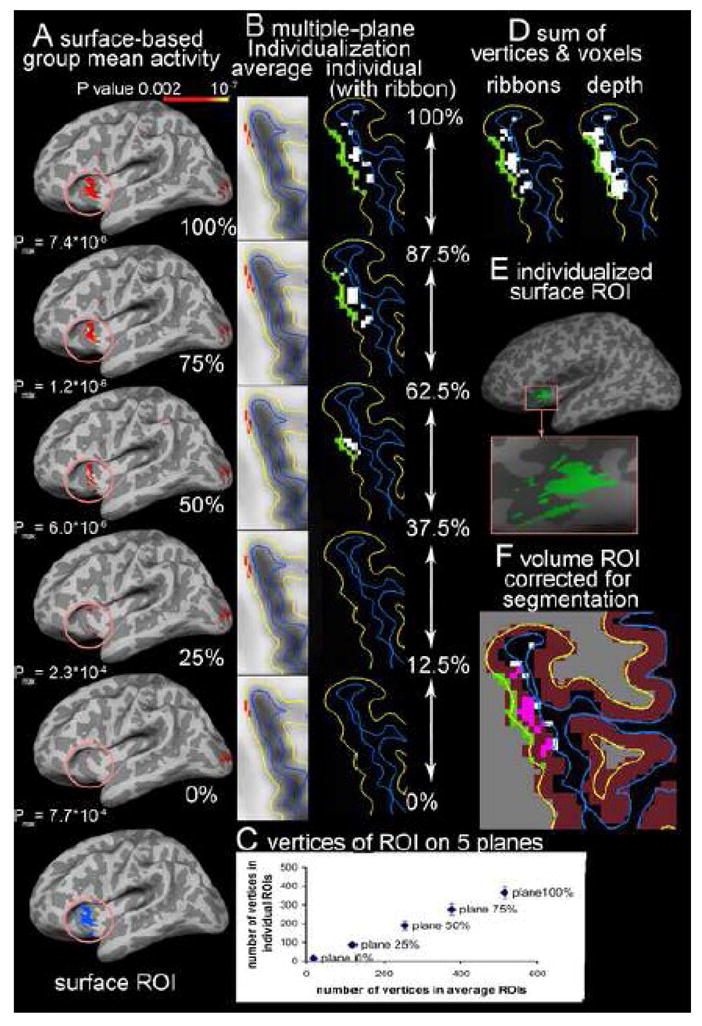
Figure 5.

Extractions of ROIs derived from multiple-plane surface-based analysis. The activity was associated with [(CS+)-fixation]. A: In the average space, the significant vertices (P<0.002) associated with [(CS+)-fixation] are identified on the planes at 100%, 75%, 50% 25% and 0% of cortical thickness from white matter (WM) surface, and the activity on 5 planes is not identical (only lateral side of left hemisphere showed). Activity in the similar insula and orbitofrontal cortex as in Figure 4 is selected (circled) as a ROI. B: the surface label (red) of significant activity on each plane is converted from average surface (average) to the individual surface (individual) of the same subject in Figure 4 to create the individualized surface label (green). The individualized label is projected to voxels (white) in the ribbons covering 12.5% of cortical thickness above and below the plane. C: the labels on 5 planes are summed to create a 2D surface ROI of this subject for cortical thickness measure. D: The hit voxels in all ribbons were summed (ribbons) to create a 3D volume ROI that contains less voxels than the 2D surface projection ROI to the entire depth of cortex (depth). E: the surface ROI occupies a similar region as the volume-based ROI, but has less discontinuation at sulcus (dark gray area) than the volume-based ROI in figure 4-C. F: The volume ROI was corrected with segmentation of gray matter (violet) in Freesurfer to identify the cortical voxels (pink) of volume ROI.
