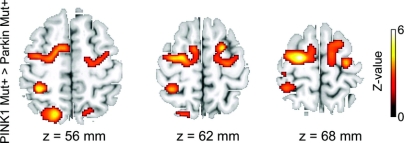
Figure 3 Relative increases in task-related blood oxygen level–dependent (BOLD) signal changes in nonmanifesting carriers of a PINK1 mutation compared with nonmanifesting carriers of a Parkin mutation
Axial slices showing voxels in dorsal frontoparietal cortex with significant increase in BOLD signal during the sequential finger movement task in PINK1 mutation carriers relative to Parkin mutation carriers. The statistical parametric maps are superimposed onto T2-weighted structural MR images provided by MRIcro (http://www.sph.sc.edu/comd/rorden/mricro.html). The voxels of the activation maps are color-coded according to their Z values. For illustrative purposes, the maps are thresholded at an uncorrected p value of p < 0.01.

