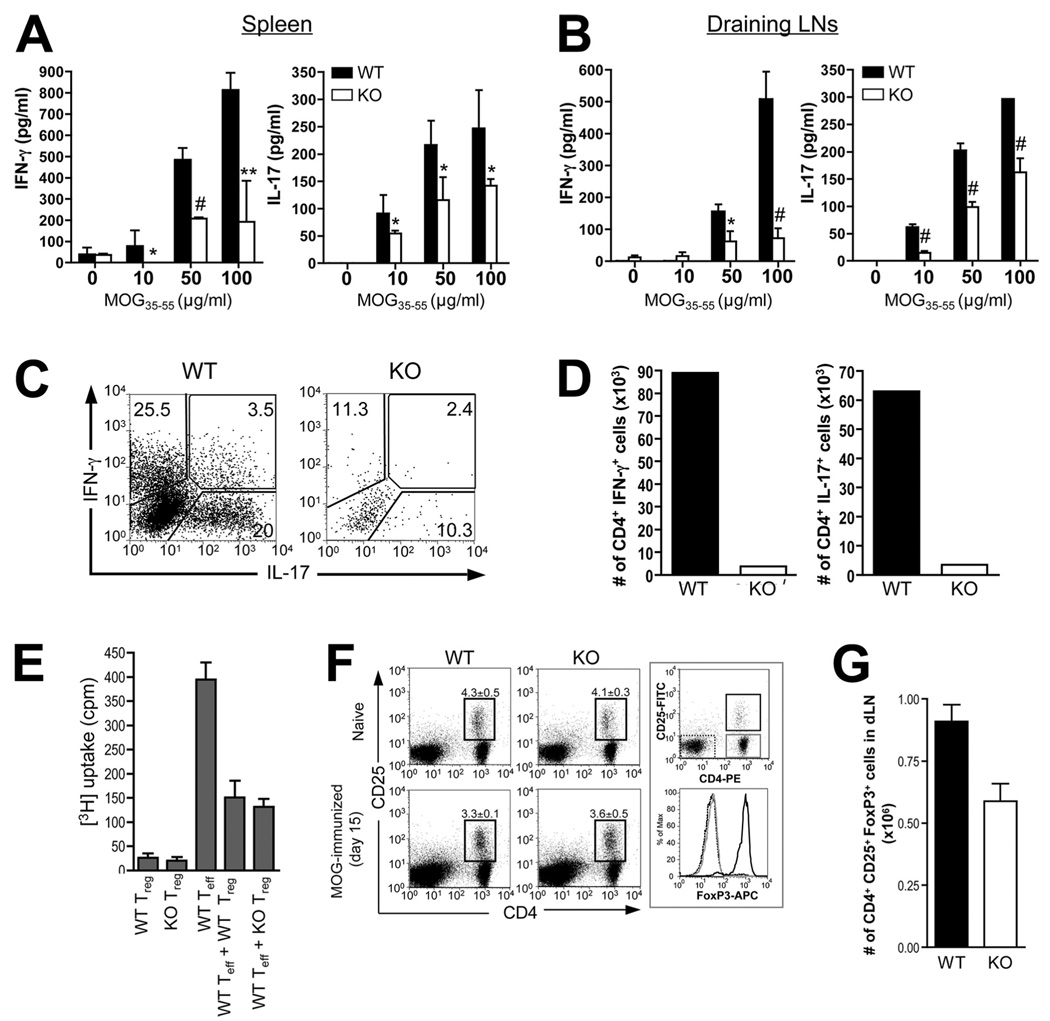
FIGURE 4.
Reduced MOG-specific Th1 and Th17 responses, but normal Treg cell compartment, in Def6−/− mice. A and B, Splenocytes (A) or dLN cells (B) from WT and KO mice isolated 8 days postimmunization were challenged in vitro with the indicated concentrations of MOG35–55 peptide, and culture supernatants collected after 72 h were analyzed for IFN-γ (left panel) and IL-17 (right panel) concentration by ELISA. Statistical differences were determined as in Fig. 1. C, Cytokine production by CNS-derived, MOG35–55-stimulated CD4+ T cells. CD4+ T cells were isolated from CNS mononuclear cells 16 days after disease induction. The cells were stimulated for 5 h in vitro with PMA plus ionomycin in the presence of GolgiStop and analyzed for IFN-γ and IL-17 expression by ICS. D, Absolute number of IFN-γ- or IL-17-producing CD4+ T cells in CNS on day 16 after MOG/CFA immunization. For C and D, cells from three mice per group were pooled for analysis. Data are representative of three experiments. E, Suppressive activity of WT and KO Treg cells. CD4+CD25+ cells (Tregs) were purified from the spleens and LNs of WT or KO mice and were added (or not) to cultures of purified CD4+CD25− WT T cells (responders). Proliferation of WT responder T cells stimulated by anti-CD3 and anti-CD28 mAbs (5 µg/ml each) was determined by [3H]TdR incorporation, and cultures of Tregs alone served as a control. Data are means ± SD of triplicate wells. The results are representative of two independent experiments. F and G, Flow cytometric analysis (F) and calculated number (G) CD4+CD25+FoxP3+ Treg cells in WT and KO mice before (naive) and 15 days after MOG/CFA immunization. dLN cells were stained for CD4, CD25, and intracellular FoxP3 expression. The right panel in F shows that CD4+CD25+ cells are mostly FoxP3+, whereas CD4+CD25− and CD4−CD25− cells are FoxP3−.

