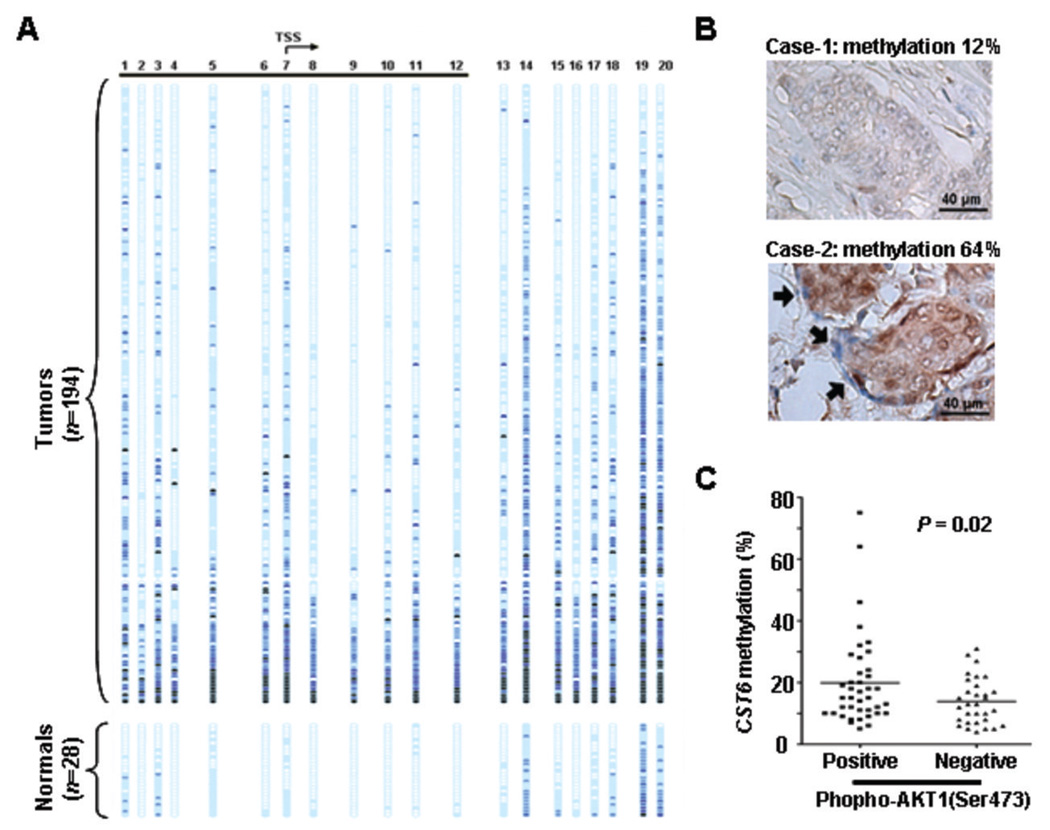
Figure 6.
Methylation analysis of CST6 and immunostaining of phospho-AKT1 in primary breast tumors. A, methylation profiles of 194 primary breast tumors (upper) and 28 normal breast tissues (lower) were shown. The MassARRAY analysis was used to determine the methylation level of each sample. The methylation difference between cancer and normal tissues was determined to be significant in the overall (p <10−6) or the underlined (p <10−6) region (t-test). B, representative examples of differential expression of phospho-AKT on breast cancer tissue sections (Case 1: weak or undetectable with score 0; Case 2: strong with score 4, see Experimental Procedures for explanation). Arrows indicate tumor stromal cells that are in close contact with cancer epithelia. C, dot-plots indicate that the level of CST6 promoter methylation is positively correlated with the phospho-AKT1 staining intensity in 72 primary tumors available for analyses. The horizontal bars indicate mean values. Significance of differences in methylation was determined by student t-test.

