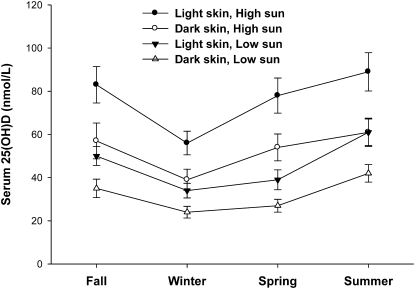
FIGURE 6 .
Multiple, linear regression model prediction of serum 25(OH)D in 4 groups based on sun exposure [20th (low) or 80th (high) percentile for each season in Joules] and skin reflectance [median forehead reflectance for participants of African (dark skin) and European (light skin) ancestry]. Study cohort dates: fall, 10/29–12/15; winter, 1/17–3/16; spring, 4/11–6/8; and summer, 7/18–9/14. Vitamin D intake was set at 200 iu(5 μg)/d. The equation is shown in Table 4, footnote 1.

