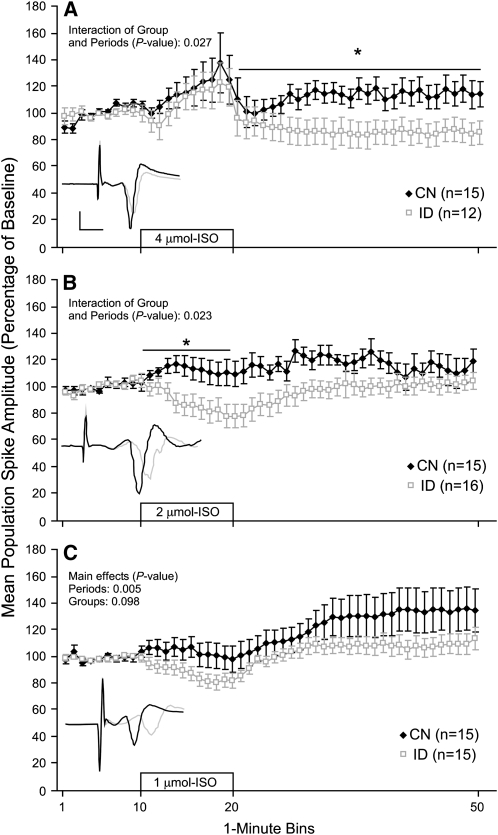
FIGURE 1 .
Population spike amplitude recorded from the CA1 area of hippocampal slices from young p26–30 rat pups before, during, and after perfusion with 4 (A), 2 (B), or 1 (C) umol/L ISO. The 10-min ISO perfusion period is indicated by the open bar starting at the 10-min mark. Insets show exemplar population spikes immediately before and 20-min after the start of ISO perfusion (calibration bars: 5 ms, 1 mV). Each slice was subjected to only 1 ISO concentration. Values are means ± SEM with the number of slices is shown in each panel. *Different from ID at these times, P < 0.05.

