
Figure 3.
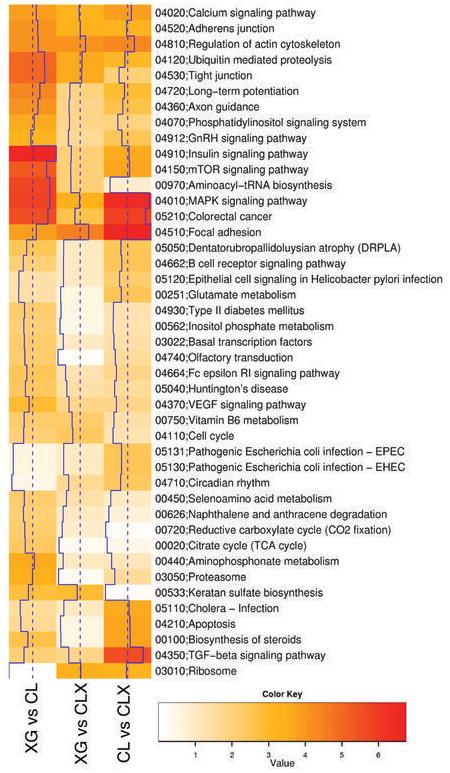
Analysis of Functional Annotation (AFA). Heat-map showing AFA results for KEGG pathways. Color-coded values correspond to absolute values of base 10 logarithms of raw P-values from the Wilcoxon rank sum test. Vertical blue lines show the same data as a histogram value for each color intensity. All pathways shown proved to be enriched in at least one comparison (adjusted P-value < 0.05). Rows were clustered using Euclidian distance and the average clustering method; columns were not reordered. Several pathways showed significant results changes in all comparisons, although different sets of genes proved to be responsible for the enrichment, while a number of pathways (i.e. Keratan sulfate biosynthesis) proved to be enriched in a subset of the contrasts considered (see Supplementary Tables A–C for genes involved and analysis of additional functional scopes, including Gene Ontology).