
Figure 4.
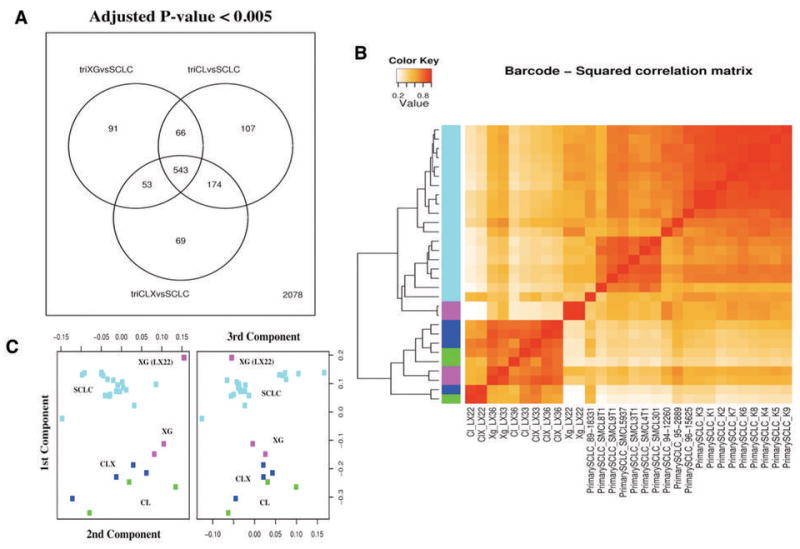
Comparison between laboratory model samples and primary small cell lung cancer (SCLC) specimens. (A) Venn diagram showing the number of differentially expressed genes (adjusted P-value < 0.005) in direct comparisons among primary xenografts (XG), the matched cell lines (CL), the xenografts obtained from these cell lines (CLX) and the group of primary SCLC. A group of 543 genes proved to be differentially expressed between all laboratory model groups (XG, CL, and CLX) and the primary SCLC. This group of genes accounts for genes expressed in cell types present only in primary tumors, such as genes expressed in lymphocytes, stromal cells present in the primary SCLC, and represent the difference in complexity between specimens obtain in vivo with respect to the laboratory models. A number of genes proved different between each group (XG, CL, and CLX) and the primary SCLC: only 91 genes were differentially expressed between XG and SCLC, while 174 were genes differentially expressed between CL and CLX and SCLC. (B) Hierarchical clustering of all pairwise squared correlations between individual samples, based on gene expression levels after barcode-RMA and quantile normalization. Individual primary Small Cell Lung Cancer (SCLC, cyan), primary xenografts (XG, purple), cell lines (CL, green), and xenografts from these cell lines (CLX, blue) are shown. Correlations were computed using all genes (181) that proved to be differentially expressed (adjusted P-value < 0.05) in any comparison between XG, CL, and CLX and that were present in all platforms. Overall the primary xenografts (XG) proved to be more correlated with the primary SCLC than any other sample. Among primary xenografts (XG), the LX22 sample proved to be more correlated to primary SCLC than to its derivative CL and CLX. (C) Multidimensional scaling plot showing the relationships among all individual SCLC, XG, CL, and CLX samples. SCLC are shown in cyan, XG in purple, CL in green, and CLX in blue. The XG samples from LX22 patient proved to be the most similar to primary SCLC samples than to its derivative CL and CLX.