
Figure 5.
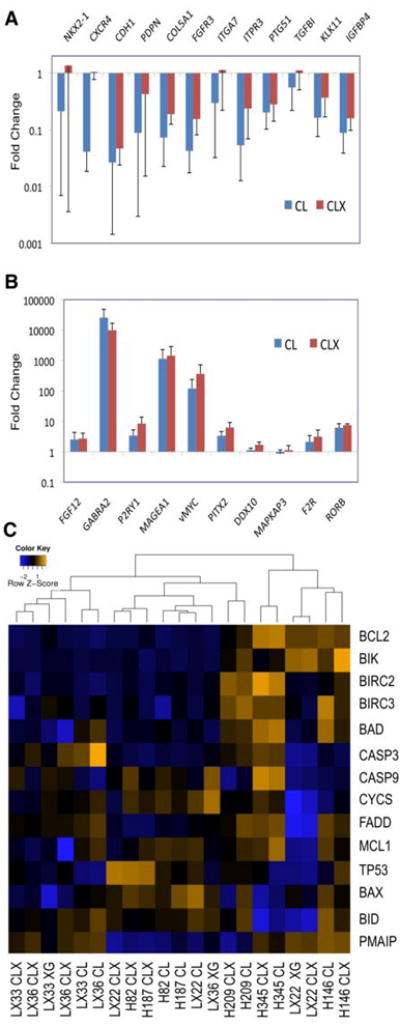
Validation of gene expression genes in the primary SCLC xenograft model. Expression levels in derivative cell lines (CL) and secondary xenografts (CLX) were compared to those in the corresponding primary xenograft, and are shown as the mean of paired data from all three xenograft lines (n=6). Error bars indicate standard errors. Genes selected from the microarray data (shown on the x axis) were upregulated (A) or downregulated (B) relative to expression in the primary xenograft samples. (C) Heat map expression analysis of BCL2-related genes in SCLC models. The RNA samples are listed as columns, and the genes in rows. The color scale represents the level of expression from low (blue) to high (orange).