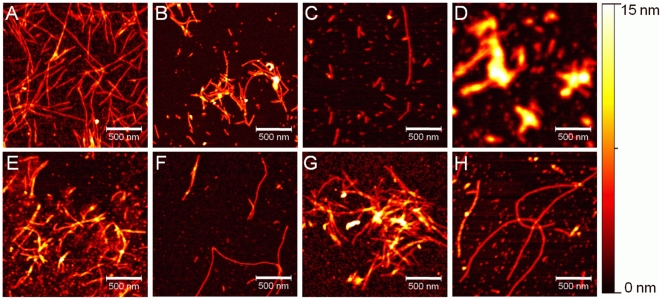
Figure 5. AFM analysis of α-syn aggregation in presence of test ligands as DOP analogs and alone.
AFM height images were acquired from assay end products, which had been deposited onto freshly cleaved mica surfaces after 100 hours of incubation. All images are displayed using the same color scale as shown on the right hand side. (A–B) 5-hydroxyindole; (C) 4-(2-aminoethyl)aniline; (D-E) 6-aminoindole; (F) 2-amino-4-tert-butylphenol; (G) tyramine; (H) α-syn only.

