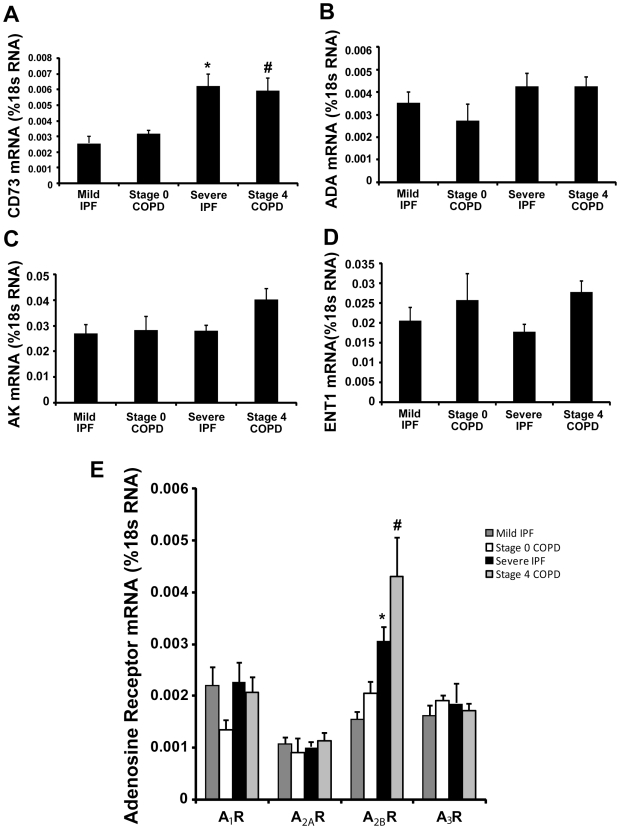
Figure 3. Expression of components of adenosine metabolism and signaling.
Transcript levels of various enzymes in adenosine metabolism, and adenosine receptors were quantified in lung RNA extracts from patients using quantitative RT-PCR. Shown are levels of (A) CD73, (B) ADA, (C) AK, (D) ENT1, (E) Adenosine receptors. Results are presented as mean percentage of 18sRNA transcripts ± SEM. *p≤0.05 versus Stage 0 COPD. #p≤0.05 versus Mild IPF. n = 4 (Stage 0 COPD), n = 10 (Mild IPF), n = 8 (Stage 4 COPD and Severe IPF).

