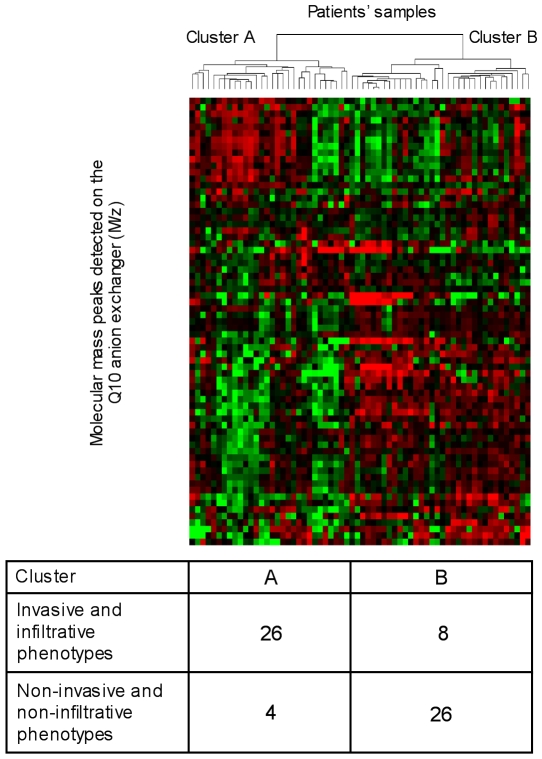
Figure 1. Unsupervised hierarchical clustering of the tumors.
Two-dimensional hierarchical clustering of 64 tumors (32 infiltrative, two invasive, and 30 noninvasive tumors) was performed with 69 molecular mass peaks after SELDI-TOF mass spectra processing with the Biomarker Wizard software (Ciphergen). Candidate markers and patient samples were clustered using complete linkage clustering methods from Eisen's cluster software. Clustered trees are displayed using Eisen's Treeview software. Red squares denote high marker concentration in comparison to average; green squares denote low concentration in comparison to average. The numbers of infiltrative or invasive samples and of noninfiltrative or noninvasive samples in the two clusters are indicated.

