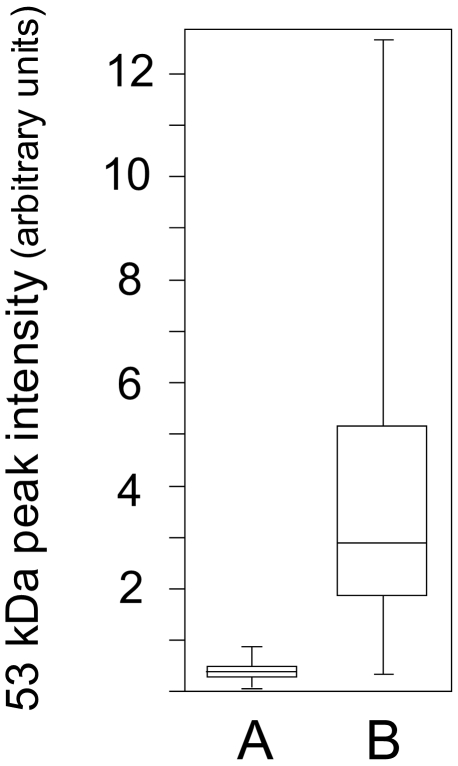
Figure 3. Quantitative assessment of the 53-kDa marker in the clinical samples.
Tumor extracts were analyzed using SELDI-TOF on Q10 anion-exchange ProteinChip Arrays, as shown in Figure 2. Signal intensity at the 53-kDa mass level were measured and calculated parameters plotted for (A) infiltrative/invasive tumor samples, (B) noninfiltrative tumor samples. Medians, 25th and 75th percentiles are marked with line segments across the boxes and the lowest and highest signal values with bars.

