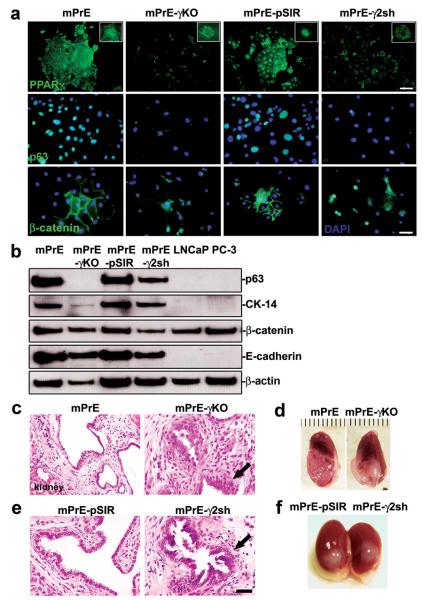
Figure 3. Consequences of PPARγ deletion and suppression in prostate epithelial cells.
(a) PPARγ, p63 and β-catenin proteins detected by immunofluorescence in mPrE, mPrE-γKO, mPrE-pSIR and mPrE-γ2Sh cells. Note the loss of nuclear PPARγ staining in mPrE-γKO and mPrE-γ2sh cells as compared to the control cells confirming the efficiency of disruption of PPARγ protein expression (higher magnification in the inset). Loss of PPARγ is associated with a loss of cobblestone morphology, cell-cell contacts, and an associated decrease in nuclear localization of p63 protein and membranous localization of β-catenin as well as nuclear transfer of β-catenin. Scale bar (PPARγ) = 100 μm. Scale bar (p63 and β-catenin) = 50 μm. (b) Western blot analysis demonstrated that p63, CK-14, β-catenin and E-cadherin proteins decreased in mPrE-γKO and mPrE-γ2sh cells compared to mPrE and mPrE-pSIR controls. LNCaP and PC-3 cells were used as the controls. (c and e) Histology of tissue recombinants using rat urogenital sinus mesenchyme (UGM) with mPrE, mPrE-γKO, mPrE-pSIR and mPrE-γ2Sh cells examined at two months post-grafting. The control recombinants resembled prostatic glandular differentiation although with some flattening of epithelial layers consistent with previous descriptions. Tissue recombinants made using mPrE-γKO (c) and mPrE-γ2sh (e) cells grew less readily. Histopathologically these structures exhibited a phenotype consistent with mPIN with epithelial crowding and tufting and out-growths (arrow). Scale bar = 50 μm. (d and f) Gross appearance of tissue recombinants using mPrE and mPrE-pSIR cells were similar, showing glandular differentiation by two months post grafting. In contrast tissue recombinants made using mPrE-γKO (d) cells and mPrE-γ2sh (f) cells grew less readily and exhibited a less obviously glandular phenotype.

