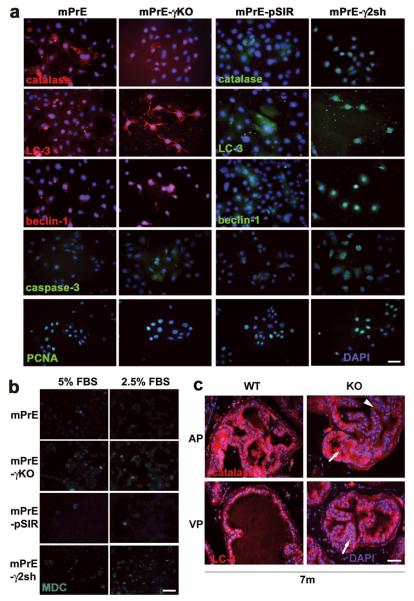
Figure 5. Alterations in autophagy-associated protein expression in mPrE-PPARγ knockout and mPrE-PPARγ2 shRNA cells.
(a) Catalase, LC-3 (Atg8), beclin-1 (Atg6), caspase-3 and PCNA proteins were detected by immunofluorescence staining in mPrE and mPrE-γKO, mPrE-pSIR and mPrE-γ2sh cells grown on glass slides for three days. Decreased catalase and increased LC-3 and beclin-1 were seen in mPrE-γKO and mPrE-γ2sh cells compared to mPrE and mPrE-pSIR cells. These results suggested active autophagic body formation in the cells. Meanwhile, caspase-3 and PCNA were increased in PPARγ-/γ2-deficient cells. Scale bar = 50μm in the panels. (b) MDC, a marker of autophagy, was visualized in mPrE and mPrE-γKO, mPrE-pSIR and mPrE-γ2sh cells under the 5% FBS regular or 2.5% FBS half-starvation culture conditions. Elevated staining was seen in both mPrE-γKO and mPrE-γ2sh cells as compared to mPrE and mPrE-pSIR cells. The signals were strongly increased in PPARγ-/γ2-deficient cells in the 2.5% FBS culture media. Scale bar = 50 μm in the panels. (c) Immunofluorescence staining of catalase and LC-3 in wild-type (WT) and PPARγ knockout (KO) prostate tissue at ages of 7 months. Low levels of catalase expression and high expression of LC-3 protein were seen in the PIN regions (arrows) of PPARγ KO mouse prostate epithelium compared to WT and more normal-appearing areas (arrowhead). Scale bar = 50 μm in the panels.

