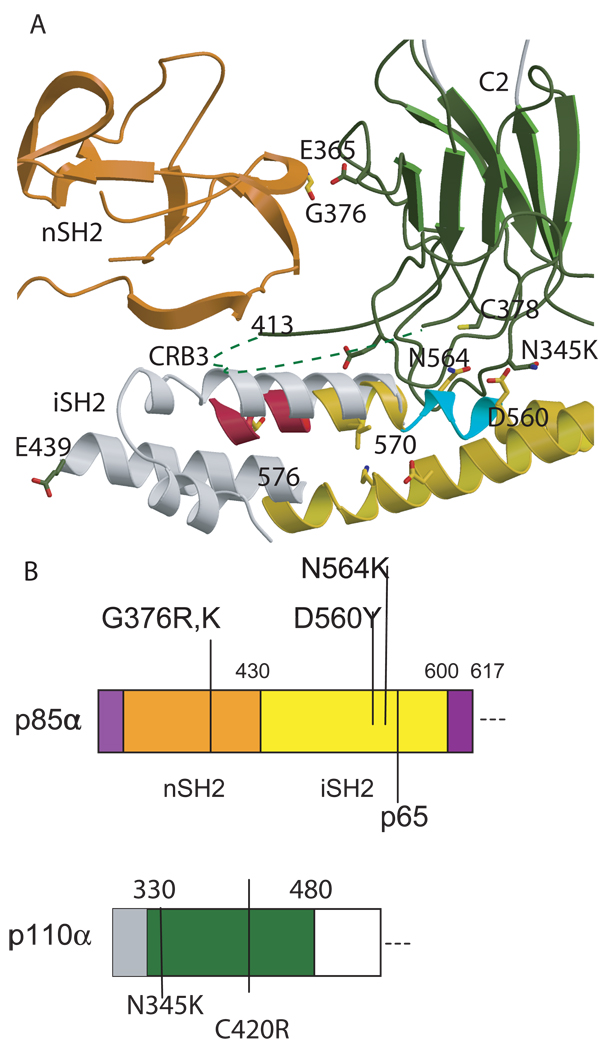
Figure 3. p85α somatic mutations at the interfase of the C2 domain the nSH2 and iSH2 domains.
A. Ribbon model of the nSH2 (orange) and the C2 domain (dark green) as observed in the structure of p110α/niSH2; the iSH2 is shown in yellow as in H1047R (pdb id 3HMM) and in grey as in 2VYI. As the connection of the coiled coil is not observed in the heterodimeric structures of p85α (pdb id 2RD0, 3HMM and 3HMI), the figure of this region in 2VY1 represents a model. The iSH2 deletions observed in glioblastoma by TCARN [33] are shown in turquoise and red ribbons. B. Scheme of the p85αniSH2 and the p110αC2 sequence with the mutations discussed in the text marked.

