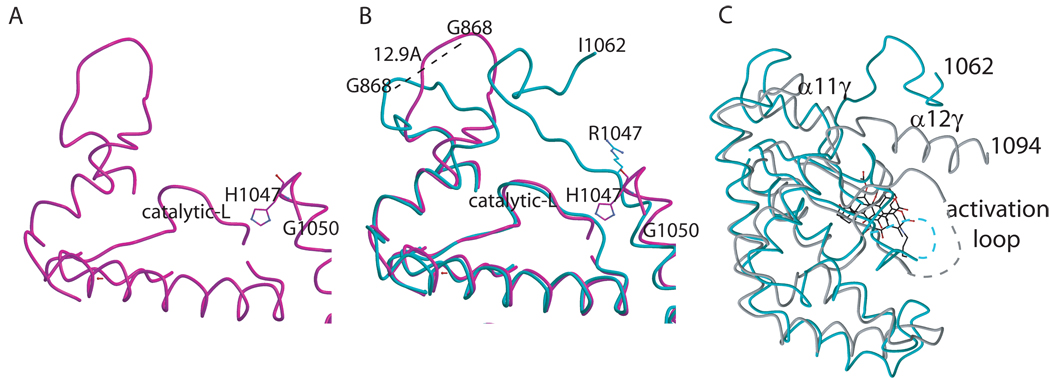
Figure 5. Conformational changes due to the H1047R mutation.
A. Ribbon diagram showing the loop 864–874 in the wild type structure. B. Ribbon diagram showing the overlap of the loops (residues 864–874 and 1050–1062) in the mutant (cyan) and the wild type (magenta). C. Structural overlap of the C-lobe PI3Kα (turquoise) and PI3Kγ (grey) kinase domains showing the differences after helix α11γ and α12α where in PI3Kα is a loop and in PI3Kγ is another helix (α12γ).

