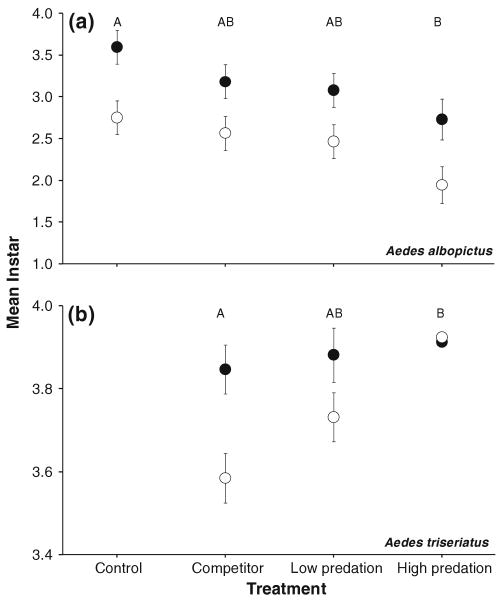
Fig. 3.
Developmental stages (least squares mean instar ± SE, across all samples from each year) for a A. albopictus and b A. triseriatus in 2005 (solid circles) and 2006 (open circles) from experimental tires with control, competitor, low and high density predators. ANOVA reported in text. For A. triseriatus in b, the control treatment is absent because no A. triseriatus were stocked into the control tires (see “Materials and methods”), and very few A. triseriatus colonized the tires. Treatments associated with the same letters (top of each graph) are not significantly different by Tukey's multiple comparisons

