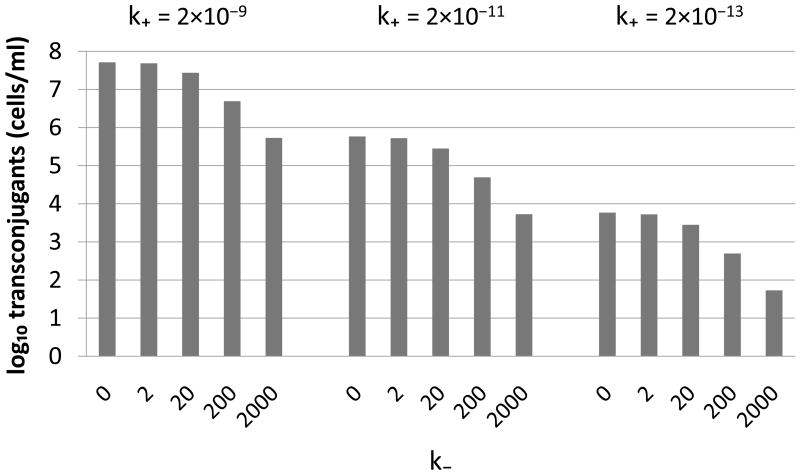
Figure 4.
Sensitivity of the transconjugant yield (T) to the attachment (k+) and detachment (k−) rates. As expected, k+ and k− affected T in opposite directions. Different values of k+ led to the same profile in transconjugant yield as a function of k−, but the level was decreased 100-fold for every 100-fold decrease in k+. Simulations were started with equal numbers of donors and recipients (5×10⁶ cells/ml), and densities were sampled after 3 h (including an initial 0.7 h lag phase for growth). Other parameters: ψR = ψD = ψT = 1.7 h−1, .

