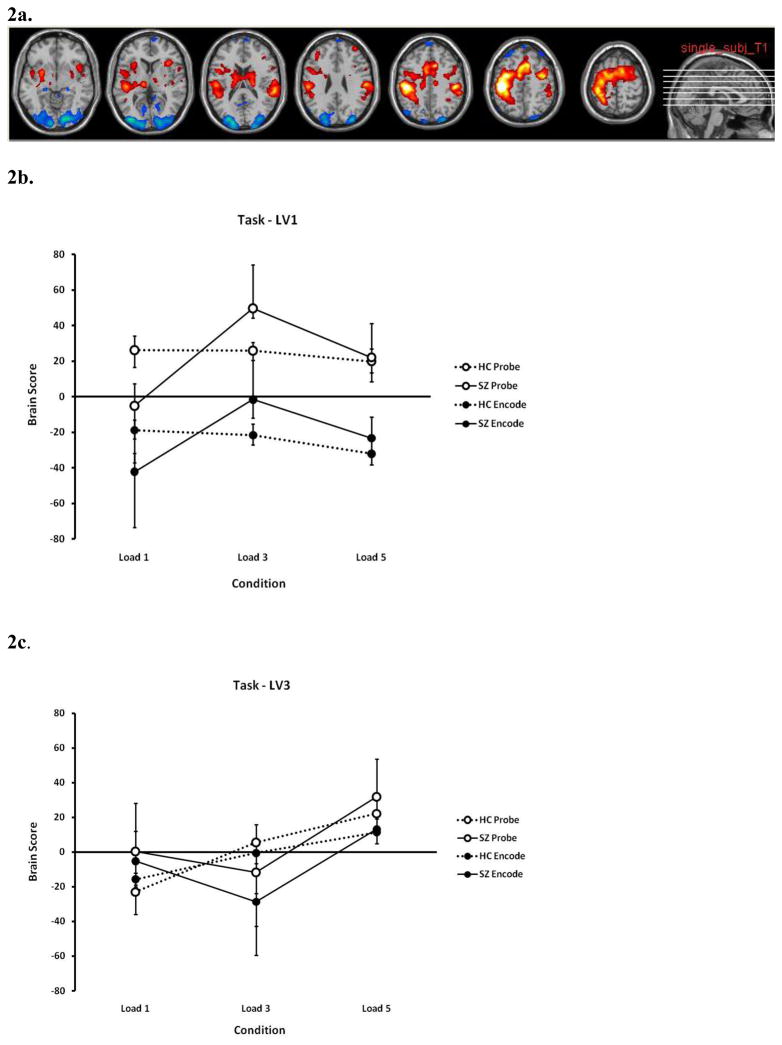
Figure 2.
Brain areas (2a) and brain score profiles for latent variables 1 (LV1) (2b) and LV3 (2c) in the Task Partial Least Squares (PLS) analysis. The areas indicated in Figure 2a are the areas which show the profile of Figure 2b. In both 2b and 2c, dashed lines indicate healthy controls (HC) and solid lines indicate schizophrenia (SZ) participants; closed circles indicate the encode conditions and open circles indicate the probe conditions. LV1 showed the distinction between areas specific to encode or probe conditions, and indicated the neural ineffiency in SZ through the hyperactivation in the moderate memory load conditions. See text for more description. See Table 2 and Supplemental Material 3 – 5 for full listings and further discussion of brain regions which were positively or negatively weighted on the various LV’s.

