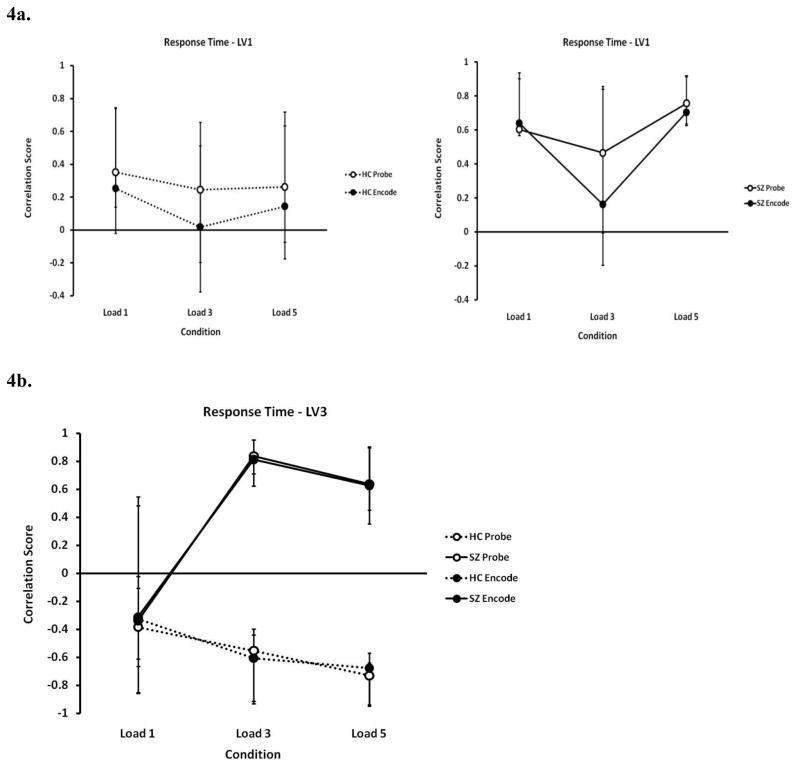
Figure 4.
Correlation score profiles for latent variable 1 (LV1) (4a – left, HC data; right, SZ data) and LV3 (4b) in the Behavior Partial Least Squares (PLS) analysis for response time (RT). Dashed lines indicate healthy controls (HC) and solid lines indicate schizophrenia (SZ) participants; closed circles indicate the encode conditions and open circles indicate the probe conditions. A strong positive correlation with RT existed across all working memory loads in the SZ group in LV1 (4a – right), while no reliable correlation was observed in the HC group (4a – left). LV3 showed that RT was dependent on different circuits in the two groups, especially for the greater loads (4b).

