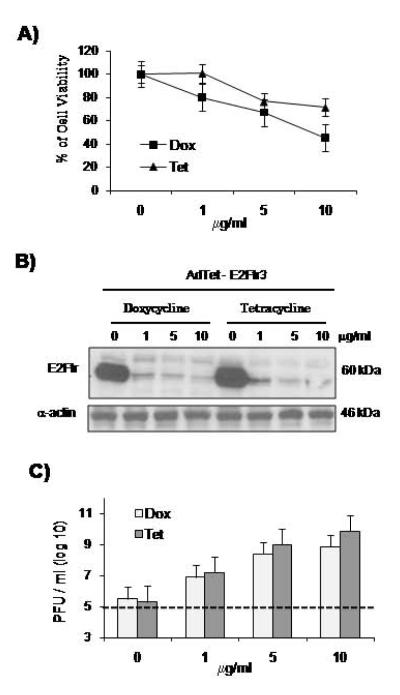
Figure 4. Comparison between Dox and Tet in HEK-293 survival E2Ftr regulation, and Ad yield.
(A) Toxicity of Dox vs Tet at 0, 1, 5, and 10 μg/ml of concentration were compared in HEK-293 cells by a MTT assay at 72 hours after drug treatments. Each point represents the mean of three independent experiments ± (SD; bars). (B) HEK-293 cells in the presence of Dox or Tet at 0, 1, 5, and 10 μg/ml were infected with AdTet-E2Ftr3 at a MOI of 5. At 24 hours after infection, cell extracts were used for western blot assay and a mAb mouse-antihuman E2F-1 was used to detect E2Ftr. α-Actin was used to demonstrate equal loading for each lane. C) HEK-293 cells were infected with AdTet-E2Ftr3 at a MOI of 5. Ad yield was determined in the presence of Dox or Tet at 0, 1, 5, and 10 μg/ml of concentration. The cultures were collected three days after infection and went through three cycles of freezing and thawing to release viruses from the cells. Lysates were serially diluted to determine the titers in HEK-293 cells. The dashed line shows the level of viruses added in the cultures. Each point represents the mean of three independent experiments ± (SD; bars).

