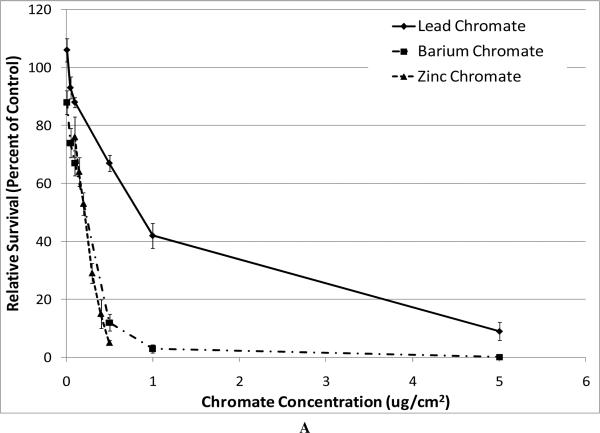
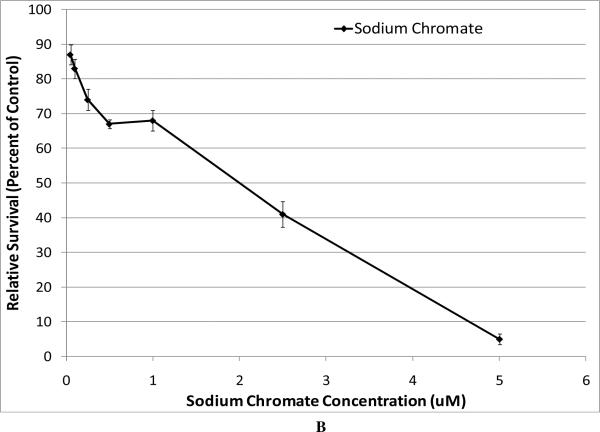
Figure 1. Cytotoxicity of Four Cr(VI) Compounds.
This figure shows the cytotoxic effect of the chromium compounds. All compounds induced a concentration-dependent decrease in relative survival. Data represent an average of at least three experiments ± SEM for all four compounds. Panel A shows the cytotoxicity of the particulate compounds. Lead chromate concentrations of 0.01, 0.05, 0.1, 0.5, 1, 5 and 10 ug/cm2 induced 106, 93, 88, 67, 42, 9 and 1 percent relative survival, respectively; barium chromate concentrations of 0.01, 0.05, 0.1, 0.5, 1, 5 and 10 ug/cm2 induced 88, 74, 67, 12, 3, 0.1 and 0 percent relative survival, respectively; zinc chromate concentrations of 0.1, 0.15, 0.2, 0.3, 0.4 and 0.5 ug/cm2 induced 76, 64, 53, 29, 15, and 5 percent relative survival, respectively. For lead chromate, concentrations of 0.1, 0.5, 1, and 5 ug/cm2 are statistically different from control (p < 0.001); for barium chromate, concentrations of 0.05, 0.1, 0.5 and 1 ug/cm2 are statistically different from control (p < 0.05); for zinc chromate, 0.15, 0.2, 0.3, 0.4, and 0.5 ug/cm2 concentrations are statistically different from control (p < 0.005). Lead chromate was statistically different from barium chromate and zinc chromate at all concentrations (p < 0.05). Panel B shows the cytotoxicity of sodium chromate, administered concentrations of 0.05, 0.1, 0.25, 0.5, 1, 2.5, 5 and 10 uM sodium chromate induced 87, 83, 74, 67, 68, 41, 5 and 0 percent relative survival, respectively. All concentrations were statistically different from control (p < 0.05).


