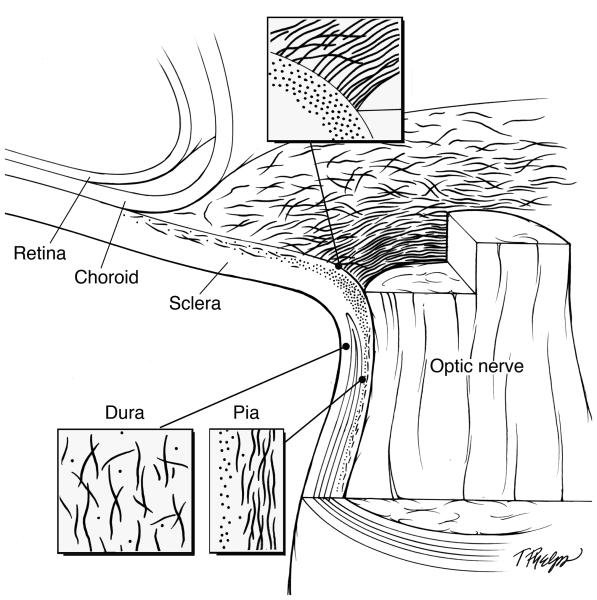
Figure 4.
Schematic illustration showing the elastin distribution and configuration. The optic nerve head, dura mater and pia mater are each magnified to show the region specific orientation of elastin. Relevant quantities of elastin fibers are depicted to demonstrate the difference of distribution in the sclera as it relates to the distance away from the optic nerve head.

