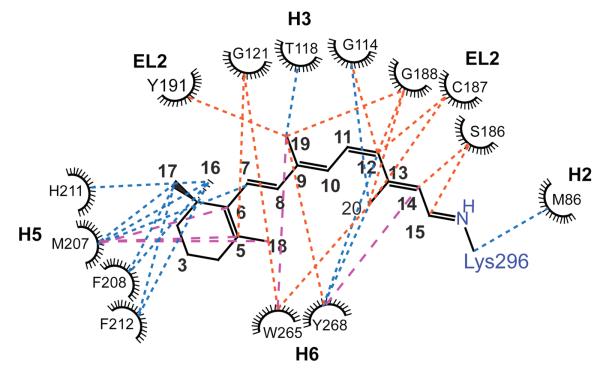
Fig. 3.
Two-dimensional residue map of close (< 6 Å) interactions near the retinal-binding site determined by 2D DARR NMR distance measurements in rhodopsin and Meta II. There are three main types interactions shown: 1) retinal-protein interactions observed in both rhodopsin and Meta II (blue dotted lines), 2) interactions that are observed in rhodopsin and are lost upon conversion to Meta II (orange dotted lines) and 3) interactions that are observed only in Meta II (broken magenta lines). See also Table 1.

