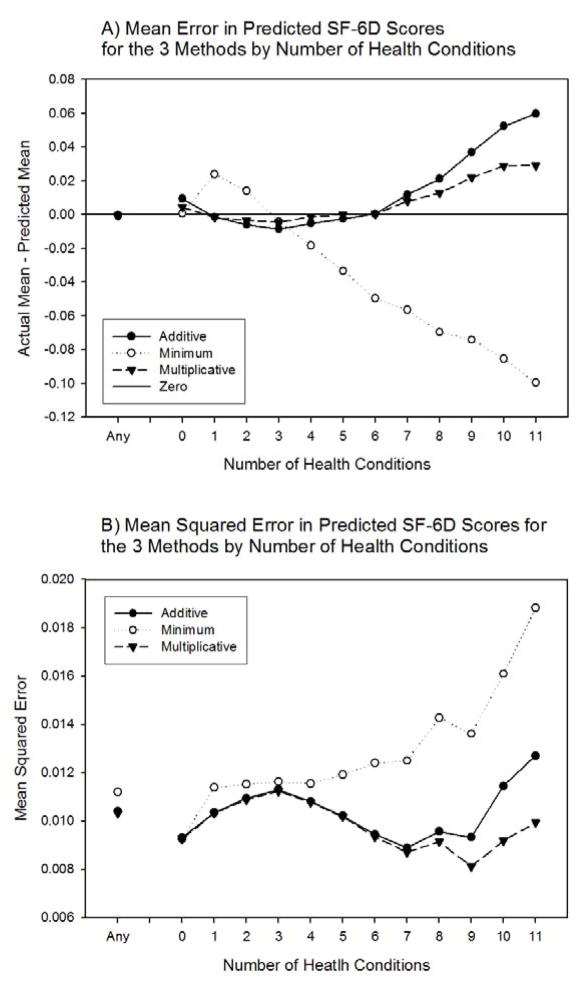
Figure 2. Mean predictive error and mean squared error for each of the three methods in the 65-and-older group.
The model using the multiplicative method has the smallest mean predictive error as well as the smallest mean squared error by number of health conditions. The model using the minimum method has the most error.

