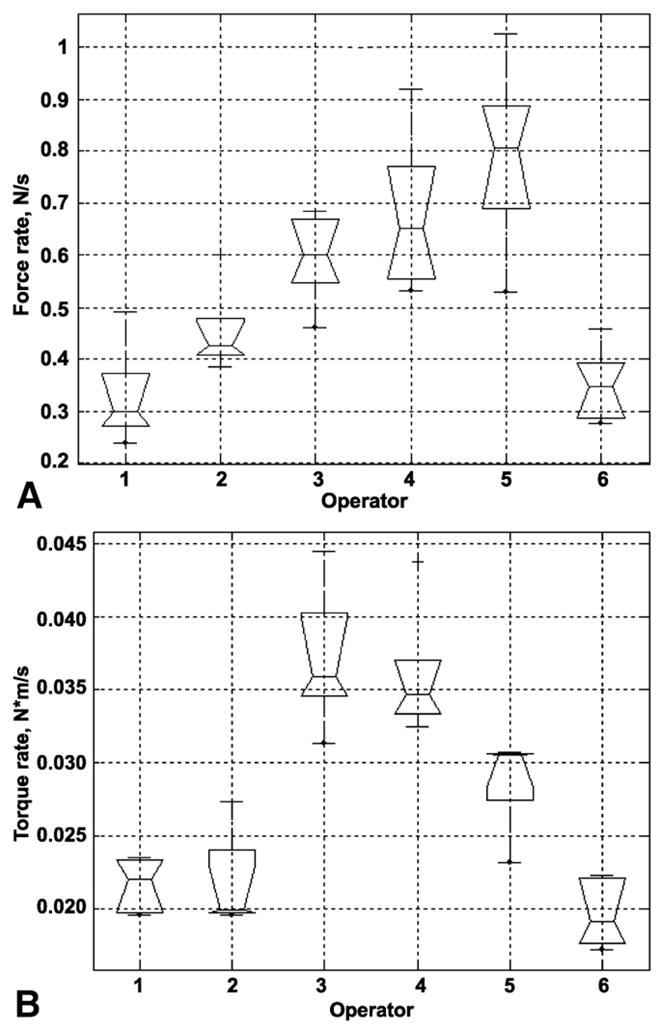
Figure 5.

Box plots for the average time derivative of force each of the 6 operators. Each box plot represents 5 completed cases. The time derivative of force is calculated as a rate of change of the force (see Methods). A, Mean push/pull force rate. B, Mean torque rate right and left.
