
Figure 5.
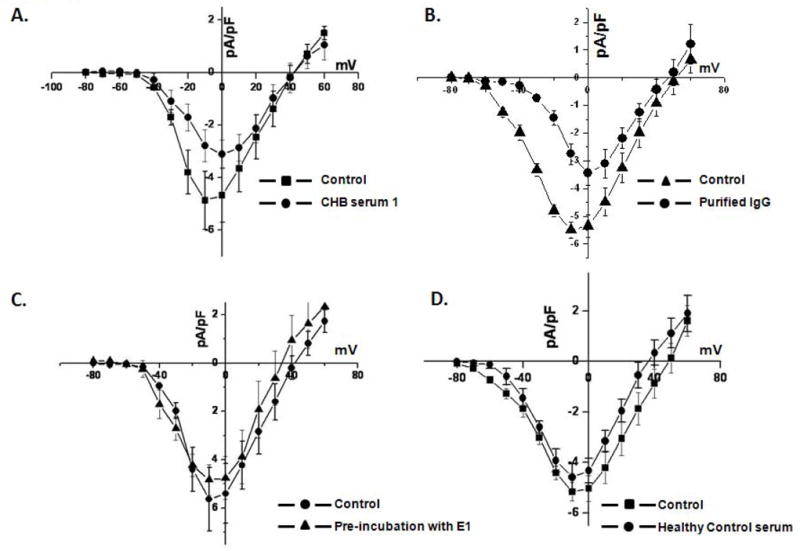
A. Effect of ELISA positive sera on the α1D ICa-L expressed in tsA201 cells. α1D ICa-L was recorded using whole cell mode of the patch clamp technique with 2 mmol/L Ca as a charge carrier. Panel A shows the current-voltage relationships for the α1D ICa-L densities during control and in the presence of ELISA positive serum 1. Panel B shows the current-voltage relationships for the α1D ICa-L densities during control and purified IgG from serum 1. Panel C shows the current-voltage relationships of the α1D ICa-L densities before and after the application of preincubated serum 1 with E1 fusion protein. Panel D shows the current voltage relationships for the α1D ICa-L densities before and after application of the healthy control serum.