
Figure 3.
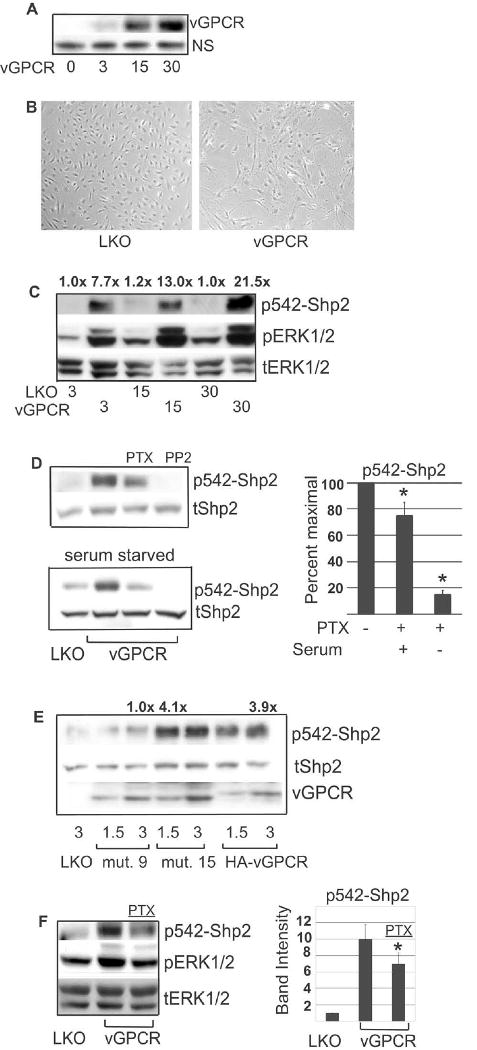
Lentiviral transduction of vGPCR into BOEC results in a Gαq- and Gαi-dependent increase in phosphorylated form of Shp2. (A) BOEC cells were transduced with lenti-vGPCR at MOI shown. After 48 hours, RIPA lysates were immunoblotted for vGPCR. ‘NS’ designates a non-specific band. (B) Micrograph showing lenti-vGPCR induced change in morphology from cobblestone to spindled. (C) BOEC were transduced with control lentivirus (LKO) or lenti-vGPCR at MOI shown. At 48 hours RIPA lysates were transferred to PVDF which was cut and simultaneously immunoblotted for p542-Shp2, and pERK1/2; blot was stripped and re-probed for total ERK1/2 as a loading control. Numbers above bands represent p542-Shp2 band density normalized to corresponding loading control and then normalized to control, lane 1. (D) BOEC were lenti-transduced with control virus (LKO) or vGPCR at an MOI of 3. Forty eight hours later, cells were serum-starved (bottom panel) or not (top panel). At 60 hours post-transduction PTX (100 nM), or the Src inhibitor PP2 (5 μM) were added and protein lysates harvested and immunoblotted for p542-Shp2 at 72 hours post-transduction. Blots were stripped and re-probed for total Shp2. Graph to right represents p542-Shp2 band densities normalized to loading control and then normalized to peak levels in the corresponding lane 2. Bands were undetectable in PP2 lanes and not represented graphically. (E) BOEC were lenti-transduced with LKO, HA-vGPCR, vGPCR mutant #9 (inactive) or vGPCR mutant #15 (Gq-only), each at two different MOI as shown. After 72 hours cells were harvested for protein and immunoblotting done for p542-Shp2, total Shp2 and vGPCR. Lanes 3, 4 and 7 had most similar amounts of vGPCR construct and were used for densitometry in which p542-Shp2 and vGPCR bands were normalized to tShp2 loading control and then p542-Shp2 normalized to corresponding vGPCR band. Densities were normalized to inactive mutant, lane 3, and fold change shown numerically above bands. (F) Lenti-vGPCR infected BOEC were serum- starved overnight 60 hours post-transduction. 30 minutes before harvesting protein, 100 nM PTX was added where indicated. p542-Shp2 bands were quantified and normalized to tERK1/2 loading control and then to control, lane1, and represented graphically. PTX, pertussis toxin. Bars= S.D. *= p≤0.05