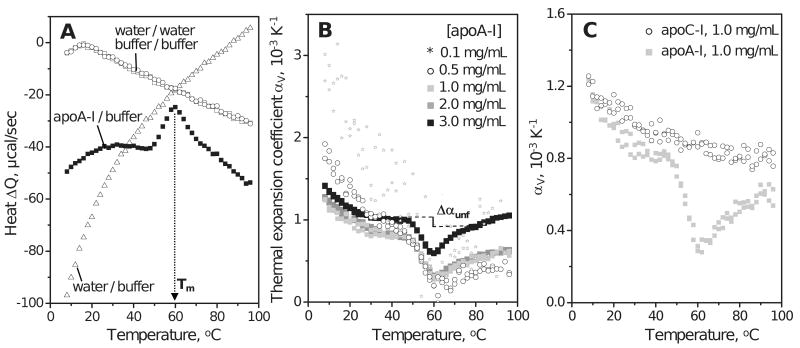
Figure 2.
PPC of lipid-free apolipoproteins in aqueous solution. Standard buffer conditions are 10 mM Na Phosphate, pH 7.7; temperature increment is 2 °C. (A) PPC data of human apoA-I (3 mg/mL protein) showing heat released / absorbed upon pressure increase / release by 5 bar. Heat absorbed upon pressure release is shown with inverse sign. The Q(T) data recorded upon pressure increase and release closely superimpose (black squares). The peak centered near 60 °C reflects unfolding of the secondary structure in apoA-I (12). Open symbols show water-water, buffer-buffer and buffer-water baselines. (B) Thermal expansion coefficient αv(T) of apoA-I (0.1–3.0 mg/mL protein). ApoA-I is fully monomeric up to 0.1 mg/mL protein but self-associates at higher concentrations. Change in volume expansion coefficient upon unfolding, Δαunf, is illustrated by a vertical line; due to the uncertainty in the choice of the pre- and post-transitional baselines that are extrapolated to the transition range (dashed lines), the value of Δαunf may vary from 0.0 to -2.0·10-4. (C) Thermal expansion coefficient αv(T) of human apoA-I and apoC-I (1 mg/mL protein).

