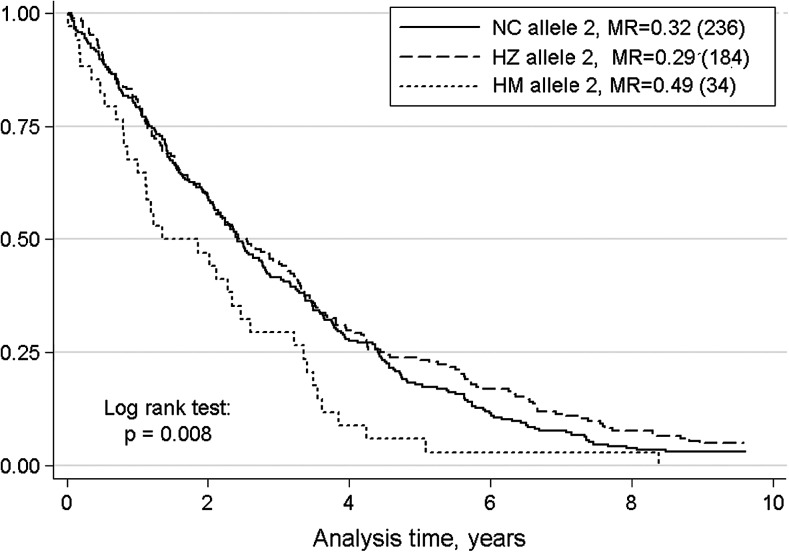
Figure 1.
Kaplan–Meier survival estimates in men from the Danish 1905 cohort (N = 454) stratified by the occurrence of the risk allele 2 at TNFa locus. NC, noncarriers of the risk allele; HZ, heterozygote for the risk allele; HM, homozygote for the risk allele. Log rank test shows significant difference in the survival pattern between the three groups. Mortality rates and total numbers of individuals in each stratum are reported in legend. IL = interleukin; TNF = tumor necrosis factor.

