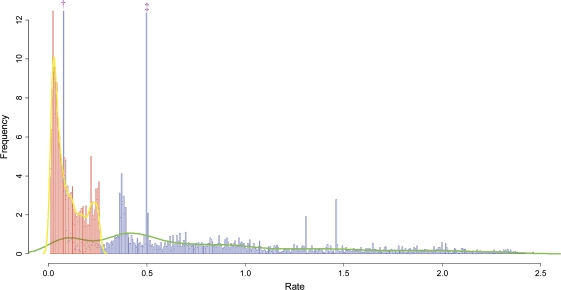
FIG. 2.
The empirical distributions of gain and loss rates. The empirical distribution of gain rates (red) and loss rates (blue) were computed for all 4,873 COG gene families. The bins denoted by the symbols “†” and “‡” represent the loss rate of the 63 gene families that are present in all species and the loss rate of the 288 gene families that are present only in the three eukaryotes, respectively.

