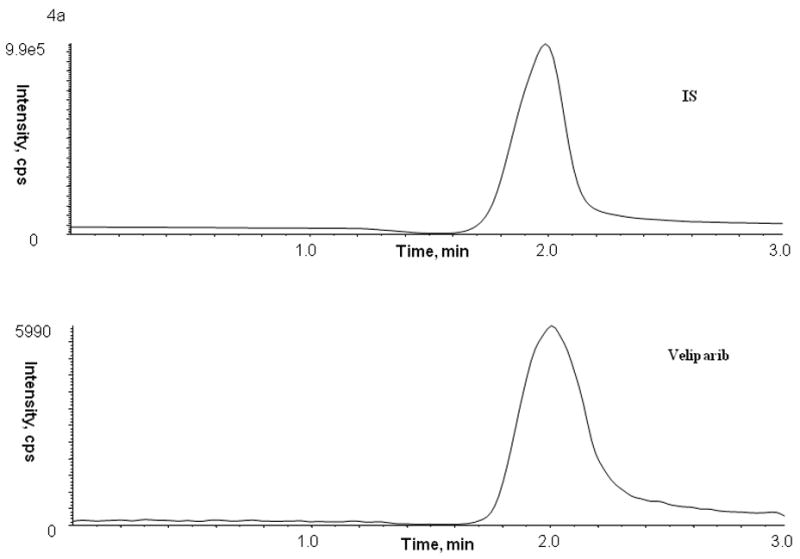
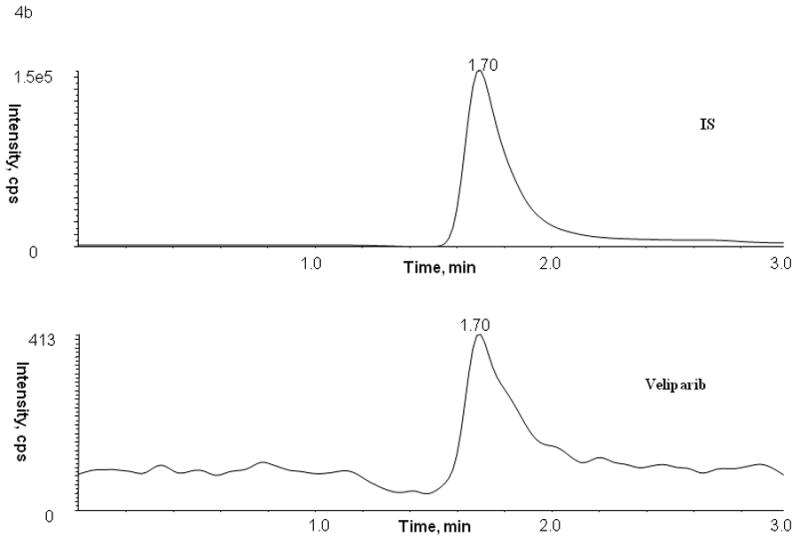
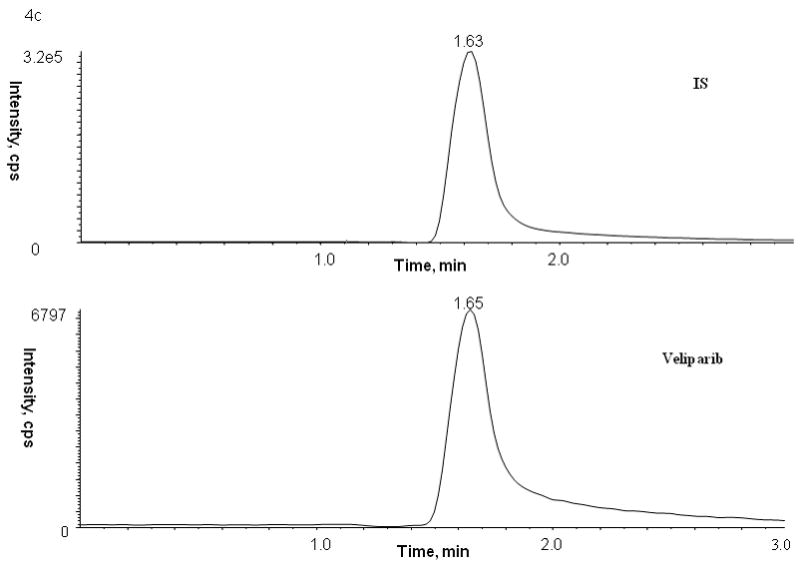
Figure 4.


Representative patient chromatograms of internal standard (top panel) and veliparib (bottom panel) (A) plasma C1D1 8 hr after veliparib administration, (B) bone marrow cells C1D4 5.25 hr after veliparib administration with 28 × 106 cell count, and (C) bone marrow supernatant C1D4 5.25 hr after veliparib administration.
