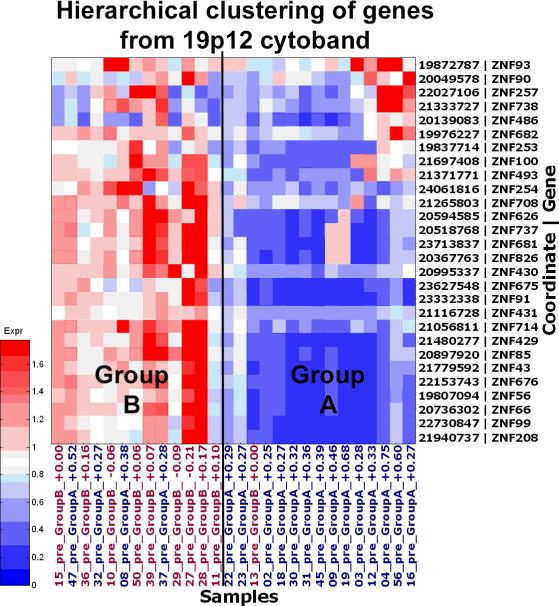
Figure 2. Gene expression profiles associated with response to IM.
A heat map showing the HSA19p12-13.1 KRAB-ZNF hierarchical cluster. In the image blue represents down-regulation, whereas red represents up-regulation. Patients who initially responded rapidly to IM clearly show decreased KRAB-ZNF expression compared to the others.

